

INTRODUCTION
The emergence of severe acute respiratory syndrome coronavirus 2 (SARS-CoV-2) in late 2019 caused a global pandemic, leading to multifaceted impacts on public health systems, economies, and daily life. By September 2024, the pandemic had resulted in a cumulative total of approximately 776,205,140 confirmed cases and 7,064,380 fatalities worldwide, currently having transitioned to an endemic form (1). Nations implemented diverse prevention and control strategies depending on disparate conditions including healthcare infrastructure, economic stability, socio- cultural factors, and climatic variables. These heterogeneous approaches led to significant regional variations in the transmission trajectory, duration, and severity of the disease (2).
Governmental responses to the pandemic are generally categorized into non-pharmaceutical interventions (NPIs) and pharmaceutical interventions (PIs). NPIs include strategies such as quarantine for social distancing, travel restrictions, telecommuting, remote learning, limitations on public gatherings and business hours, and personal hygiene measures including mask-wearing, hand hygiene, and contact tracing. PIs encompass pharmacological treatments aimed at the prevention, management, and therapy of the disease. These non-pharmaceutical strategies were primarily utilized to mitigate or suppress rapid outbreaks. Furthermore, complex interactions occur between NPIs and PIs, exerting combined effects on the transmission dynamics within communities (3, 4, 5).
Regional differences in the implementation and accessibility of NPIs and PIs are heavily influenced by social structure and public compliance (6). Countries with robust healthcare systems and high levels of public trust exhibited relatively high adherence to NPIs, whereas nations with fragmented systems and low public trust showed lower compliance. Behavioral characteristics of a society also played a critical role; for instance, the strong sense of community responsibility and high conformity to public policy in East Asian countries have been observed to enhance the efficacy of NPIs. In contrast, Western nations, which prioritize individual liberties, showed comparatively lower NPI effectiveness (6).
Variations were also observed in the acceptance rates of vaccination, a component of PIs. While the Asia-Pacific region demonstrated high SARS-CoV-2 vaccine acceptance, vaccine hesitancy was markedly higher in Western and Central Europe (7). These findings suggest that the independent and combinatory effects of NPIs and vaccination can vary significantly by region. Consequently, understanding the transmission trajectory of SARS-CoV-2 necessitates comprehensive research that integrates regional and social characteristics alongside NPIs and PIs.
In response to this necessity, Ge et al. reported on the complex interactions between vaccination and NPIs across 31 European countries (8). The individual and cumulative effects of NPIs on a global scale have been evaluated by analyzing national and sub-national groups, yet the interactive effects with vaccination were not accounted for (3). Agent-based modeling has been used to examine the integrated effects of SARS-CoV-2 vaccines and NPIs in North Carolina (4). Integrated effects were also researched regarding California (5). Huy et al. calculated NPI efficacy in Asian countries (9), while the specific interaction between NPIs and vaccination was not quantified.
To date, research addressing the interaction between NPIs and PIs in Asian countries, including South Korea, China, and Japan, remains markedly limited. Given that compliance with public health policies varies according to behavioral patterns and social structures, there is a critical need for in-depth research into the epidemic trajectories within the Asian context. This study posits that social characteristics are reflected in the interaction between NPI efficacy and vaccination in South Korea. We quantified the relative effectiveness of NPIs and vaccination in South Korea from May 2020 to July 2022. The progressive integration of studies covering various regions will enhance the collective understanding of societal responses to and the regulation of infectious disease outbreaks.
MATERIALS & METHODS
The analytical focus of this study spans from May 2020 to July 2022 in South Korea. This timeframe encompasses the initial phase of the SARS-CoV-2 outbreak through the post-vaccination period and the subsequent surge of the Omicron variant, providing an optimal window to evaluate the combined effects of NPIs and vaccination.
Daily confirmed cases were obtained from the Korea Disease Control and Prevention Agency (KDCA) surveillance dataset (10). To mitigate the impact of reporting lags and short-term volatility, a 7-day moving average was applied to the incidence data. The calculation of the effective reproduction number () using the R package EpiEstim was included as a reference metric for comparison with the results of our Bayesian model. Data regarding the genomic sequence proportions of SARS-CoV-2 variants in South Korea were retrieved from Our World in Data repository (11).
To quantify the effect of NPIs, we utilized the stringency index provided by the Oxford COVID-19 Government Response Tracker (OxCGRT) (12). Temporal shifts in population mobility were incorporated using Google Community Mobility Reports (13).
Vaccination statistics, covering the period from February 26, 2021, to October 11, 2023, were aggregated from KDCA administrative records (14).
Additionally, meteorological data, specifically relative humidity, were sourced from the Korea Meteorological Administration (KMA) Open Data Portal (15).
Calculation of Rt via EpiEstim
To validate our Bayesian framework, we derived daily estimates of using EpiEstim, which is based on the Susceptible- Infectious-Recovered (SIR) model (16). Calculations were performed under the assumption that the average Serial Interval (SI) is equivalent to the average Generation Time (GT), presupposing that the primary and secondary cases share identical incubation periods (17).
While SARS-CoV-2 exhibits infectivity up to 48 hours prior to symptom onset, the SI can serve as a proxy for the Generation Interval (GI), as it accounts for the time until symptoms manifest in the secondary case. Under the premise of uniform incubation periods among cases, the interval between primary and secondary infections—the GI—can be effectively approximated by the SI. The SI values used in this study were adopted from preceding studies.
Most prevalent variants at specific timeframes in South Korea were identified using the sequence proportion dataset from Our World in Data. Specifically, we applied the SI for the Wuhan strain (January 2020 – July 2021), the Delta variant (August 2021 – December 2021), and the Omicron variant (January 2022 onwards).
Although discrepancies exist between global SI estimates and those specific to South Korea, we prioritized domestically derived values. This decision reflects the fact that SI is influenced by NPI stringency and socio-behavioral patterns. In this model, the SI was treated as a fixed parameter corresponding to the predominant variant during each period. The mean SI values utilized were 4.0 days for the Wuhan strain, 3.3 days for the Delta variant, and 4.2 days for the Omicron variant (18, 19, 20).
Analysis Methodology for R(0, t)
The instantaneous basic reproduction number, denoted as , represents the baseline transmissibility at time , adjusted for the prevalence of specific SARS-CoV-2 variants. This value incorporates monthly proportion weights for each variant to reflect temporal shifts in the viral landscape. The mathematical formulation for is as follows (8).
: The proportion (weight) of infections caused by variant at time
: The basic reproduction number of variant
To determine , we applied weighting indices relative to the Wuhan strain. Based on an extensive literature review, the transmissibility of subsequent variants was quantified using the following weight factor. Alpha had a weight of 1.29 (1.24 – 1.33), Beta 1.25 (1.20 – 1.30), Gamma 1.38 (1.29 – 1.48), Delta 1.97 (1.76 – 2.17), and Omicron 4.93 (4.40 – 5.43) (21, 22, 23). These indices represent the relative transmission potential of each variant compared to the baseline of the Wuhan strain. For our statistical model, we assumed these weighting indices follow a normal distribution.
Recognizing that prolonged implementation of NPIs may alter population behavior and compliance patterns over time, we established the prior distribution for based on empirical observations from the pre-vaccination period. Specifically, the maximum observed value of the time-varying reproduction number () during the pre-vaccination window (August 2020 to February 2021) was utilized as the mean for the prior distribution.
In South Korea, the initial pandemic wave was observed between February 18, 2020, and May 5, 2020 (24), during which was estimated at 3.5 (25). However, for the specific period from August 1, 2020, to February 2021, the peak average value was recorded at 2.02, which informed our baseline parameters for subsequent modeling.
Selection of the NPI Stringency Index
To incorporate the impact of governmental NPIs as a reduction factor for SARS-CoV-2 transmissibility, we utilized the Oxford COVID-19 Government Response Tracker (OxCGRT) indices. Specifically, we calculated the Openness Risk at time based on the six policy recommendations proposed by the World Health Organization (WHO) to mitigate risks associated with easing NPIs: Transmission controlled, Test/trace/isolate, High vulnerability settings, Preventative measures established in workplaces, Management of importation/exportation risks, and Community engagement and behavior change (26). For this study, the metrics for Test/trace/isolate and Management of importation/exportation risks were partially adjusted to align with the specific characteristics of the South Korean surveillance data.
The measurement of Openness Risk using WHO indicators was synthesized from four composite sub-indices: CC, TT, M, and C (27). CC (Confirmed Cases) index assesses whether disease transmission is sufficiently limited relative to healthcare capacity. It was calculated by normalizing the daily number of confirmed cases against a baseline threshold of 50. TT (Testing and Tracing) represents the sufficiency of the medical infrastructure. We utilized the OxCGRT Testing Policy indicator (H2) and the Contact Tracing Policy indicator (H3) for this metric. M (International Mobility) reflects importation and exportation risks, derived from the OxCGRT International Travel Restrictions indicator (C8). C (Community Engagement) index measures the level of community participation and adherence. It was calculated using a combination of the CC index and the ‘mob’ index, which reflects temporal mobility levels relative to the pre-pandemic baseline based on Google Community Mobility Reports.
For the mobility data, we applied a calibration range where values were capped at a minimum of 20 and a maximum of 120. Furthermore, if the OxCGRT Public Information Campaigns indicator (H1) was recorded at a level below 2, the community engagement index was set to 0 to reflect inadequate public communication.
Using the four indices, we calculated the unadjusted openness risk with the following equation.
The unadjusted openness risk () is primarily calculated based on the number of confirmed cases managed under national control measures. This metric assumes an idealized scenario, representing the risk associated with lifting public health measures provided that the entire population has completed the prescribed vaccination series. To better reflect empirical trends, we incorporated vaccination coverage as a proxy for the proximity to national-level herd immunity, rather than relying solely on incidence data. By adjusting the raw values with vaccination rates, we derived the adjusted Openness Risk which quantifies the actual risk level of de-escalating NPIs at the national scale based on observed cases.
In applying these indicators to the South Korean context, certain modifications were made to address data unavailability and missing values. Due to the absence of a comprehensive ‘tests per case’ dataset for South Korea, the TT index was calculated exclusively using the H2 (Testing Policy) and H3 (Contact Tracing Policy) indicators from the OxCGRT database. Google Mobility data for South Korea are unavailable for the period prior to February 14, 2020. To ensure continuity with subsequent trends, missing ‘mob’ values were imputed as 20. For the ultimate risk assessment and statistical modeling, the Adjusted Openness Risk () was utilized as the primary variable.
Vaccination data
Using the statistical records from KDCA, we calculated the fully vaccinated rate, defined as the proportion of the population that completed the dosage required by each vaccine protocol. To account for the varying protection levels provided by different vaccine products, we derived the practical vaccination rate. This was achieved by applying weights based on the specific efficacy of each vaccine type administered. This metric serves to represent the actual reduction factor exerted by vaccination on disease transmission over a given period. The calculation is as follows:
where represents the efficacy of vaccine type , and represents the proportion of vaccine type utilized among all administered doses at time .
For the six types of vaccines administered in South Korea during the study period, we calculated the sum of the products of their respective efficacy and utilization proportions. This weighted value was then multiplied by the fully vaccinated rate to reflect the time-varying real-world impact of the vaccination campaign.
In this study, we deliberately utilized vaccine efficacy rather than vaccine effectiveness. This choice was necessitated by the limited availability of comprehensive, domestically measured effectiveness data for each vaccine type in South Korea. In contrast, efficacy values from controlled clinical trials provided a more consistent and well-defined dataset for our modeling purposes.
Vaccination against SARS-CoV-2 in South Korea commenced on February 26, 2021. Until February 2022, detailed records were maintained for four primary vaccines: AstraZeneca (ChAdOx1 nCoV-19), Pfizer-BioNTech (BNT162b2), Janssen (Ad26.COV2.S), and Moderna (mRNA-1273). Subsequently, data collection expanded to include Novavax (NVX-CoV2373) and a category labeled “Others” (comprising WHO-approved vaccines authorized abroad but not domestically, such as Sinopharm and Sinovac).
Official daily reporting of vaccination statistics on the KDCA website was discontinued after October 2022. The specific efficacy rates and the number of doses required for full vaccination for each product were retrieved from established clinical literature and are summarized in the following sections (Table 1) (28, 29, 30, 31, 32).
Table 1.
Efficacy and required doses of SARS-CoV-2 vaccines administered in South Korea
| Vaccine | Efficacy | Dosage |
|---|---|---|
| AstraZeneca (28) | 74.0% (95% CI: 65.3 – 80.5) | 2 |
| Pfizer (29) | 95% (95% CI: 90.3 – 97.6) | 2 |
| Johnson&Johnson (30) | 66.9% (95% CI: 55.0 – 74.8) | 1 |
| Moderna (31) | 94.1% (95% CI: 89.3 – 96.8) | 2 |
| NovaVax (32) | 89.7% (95% CI: 80.2 – 94.6) | 2 |
| Sinopharm/Sinovac | 69.9% | 2 |
For the “Others” vaccine category, which includes Sinopharm and Sinovac, specific utilization ratios were not available from the KDCA records. Consequently, we assumed an equal distribution between these two vaccine types and utilized the mean of their respective efficacy rates for our calculations. The efficacy of Sinopharm and Sinovac were recorded as 72.8% and 67.0%, respectively (33).
To calculate the vaccination rate relative to the total population when explicit proportions were not provided, we utilized population figures from the Ministry of the Interior and Safety’s Resident Registration Statistics. For the period prior to July 2021, a baseline population of 51,769,539 (as of January 2021) was applied; for subsequent periods, a figure of 51,317,389 (as of December 2021) was used. It should be noted that heterologous dosing (mix-and-match vaccination) was not accounted for in this analysis.
During the early stages of the vaccination campaign, granular data regarding the number of fully vaccinated individuals per vaccine type were occasionally unavailable. To address these missing values, we utilized an approximation method based on available trends. Specifically, as only the cumulative total of fully vaccinated individuals was provided until May 10, 2021, we extrapolated the ratios observed on May 17, 2021, to estimate the preceding values.
On May 17, the ratio of fully vaccinated individuals (those who received the second dose) was 0.006 for AstraZeneca versus 0.994 for Pfizer. This significantly differed from the combined ratio of first and second-dose recipients recorded on May 10, which was 0.482 for AstraZeneca versus 0.518 for Pfizer. We concluded that applying the May 17 ratio to the prior cumulative total of fully vaccinated individuals would yield a more accurate approximation than using a simple ratio of total recipients. Accordingly, the cumulative number of fully vaccinated individuals per vaccine type for all dates prior to May 17 was estimated by applying this 0.006 : 0.994 ratio to the total reported figures.
Control Variables: Incorporation of Humidity
In addition to the primary variables of NPIs and vaccination, humidity was included as a control variable due to its established impact on the transmission dynamics of SARS-CoV-2. This selection is based on empirical evidence demonstrating a non-linear relationship between decreased absolute humidity and the prolonged environmental stability of enveloped viruses (34).
Incorporating Variables into the Transmission Rate (Bayesian Modeling)
In this study, a Bayesian workflow was employed to quantify both the individual and integrated effects of various factors influencing the transmission dynamics of SARS-CoV-2. This probabilistic approach allows for the estimation of uncertainty and the incorporation of prior knowledge regarding epidemiological parameters. To evaluate the impact of the calculated variables on the viral transmission rate, we used the following Bayesian hierarchical model:
: The force of infection at time , under policy combination
: The instantaneous basic reproduction number (basic transmissibility) at time
: The NPI Stringency Index at time
: The practical vaccination rate at time
: The humidity at time
: Other variables influencing transmission at time
By comparing the estimated with , we quantified the extent to which NPIs and vaccination influenced the transmission of SARS-CoV-2. To examine the dynamics between these interventions, we introduced an interaction term. Furthermore, since the scales of the independent variables (NPI intensity, vaccination rates, humidity, and other factors) differ significantly, we utilized regression coefficients as transformers to normalize these metrics. This approach allowed us to interpret the direction, magnitude, and interactions of each factor on as intuitive percentage changes.
The prior distributions for the coefficients were defined as follows:
Given the prior expectation that NPIs and vaccination act primarily as suppressors of viral transmissibility, we assigned priors to the magnitudes of their effects and their interaction term. This constraint ensures numerical stability and maintains the interpretability of the results within a logically consistent range. Conversely, humidity () and other residual factors () were hypothesized to exert either positive or negative pressures on transmission. Consequently, we employed Normal priors to allow for greater flexibility in capturing these bidirectional effects.
For the likelihood of , a Gamma distribution was utilized, with the standard deviation fixed at 0.5 to prevent model divergence (8). The relative contribution of NPIs and vaccination to the reduction of SARS-CoV-2 transmission on a monthly basis was then derived using the following mathematical framework:
RESULTS
Bayesian Estimation of Rt
Our analysis indicates that from May 2020 to March 2021, non-pharmaceutical interventions (NPIs) accounted for a minimum of 55.5% (CrI:55.8 - 59.4) to a maximum of 77.8% (CrI:73.3 – 81.1) monthly reduction in SARS-CoV-2 transmission. Following the introduction of vaccination in April 2021 until July 2022, the inhibitory effect of NPIs remained stable, ranging between 68.6% (CrI:63.8 – 72.5) and 77.8% (CrI:73.3 – 81.1) (Fig. 1). This suggests that the baseline efficacy of NPIs did not diminish significantly following the commencement of the vaccination campaign. The posterior median and 95% CrI of key months are as follows (Table 2)
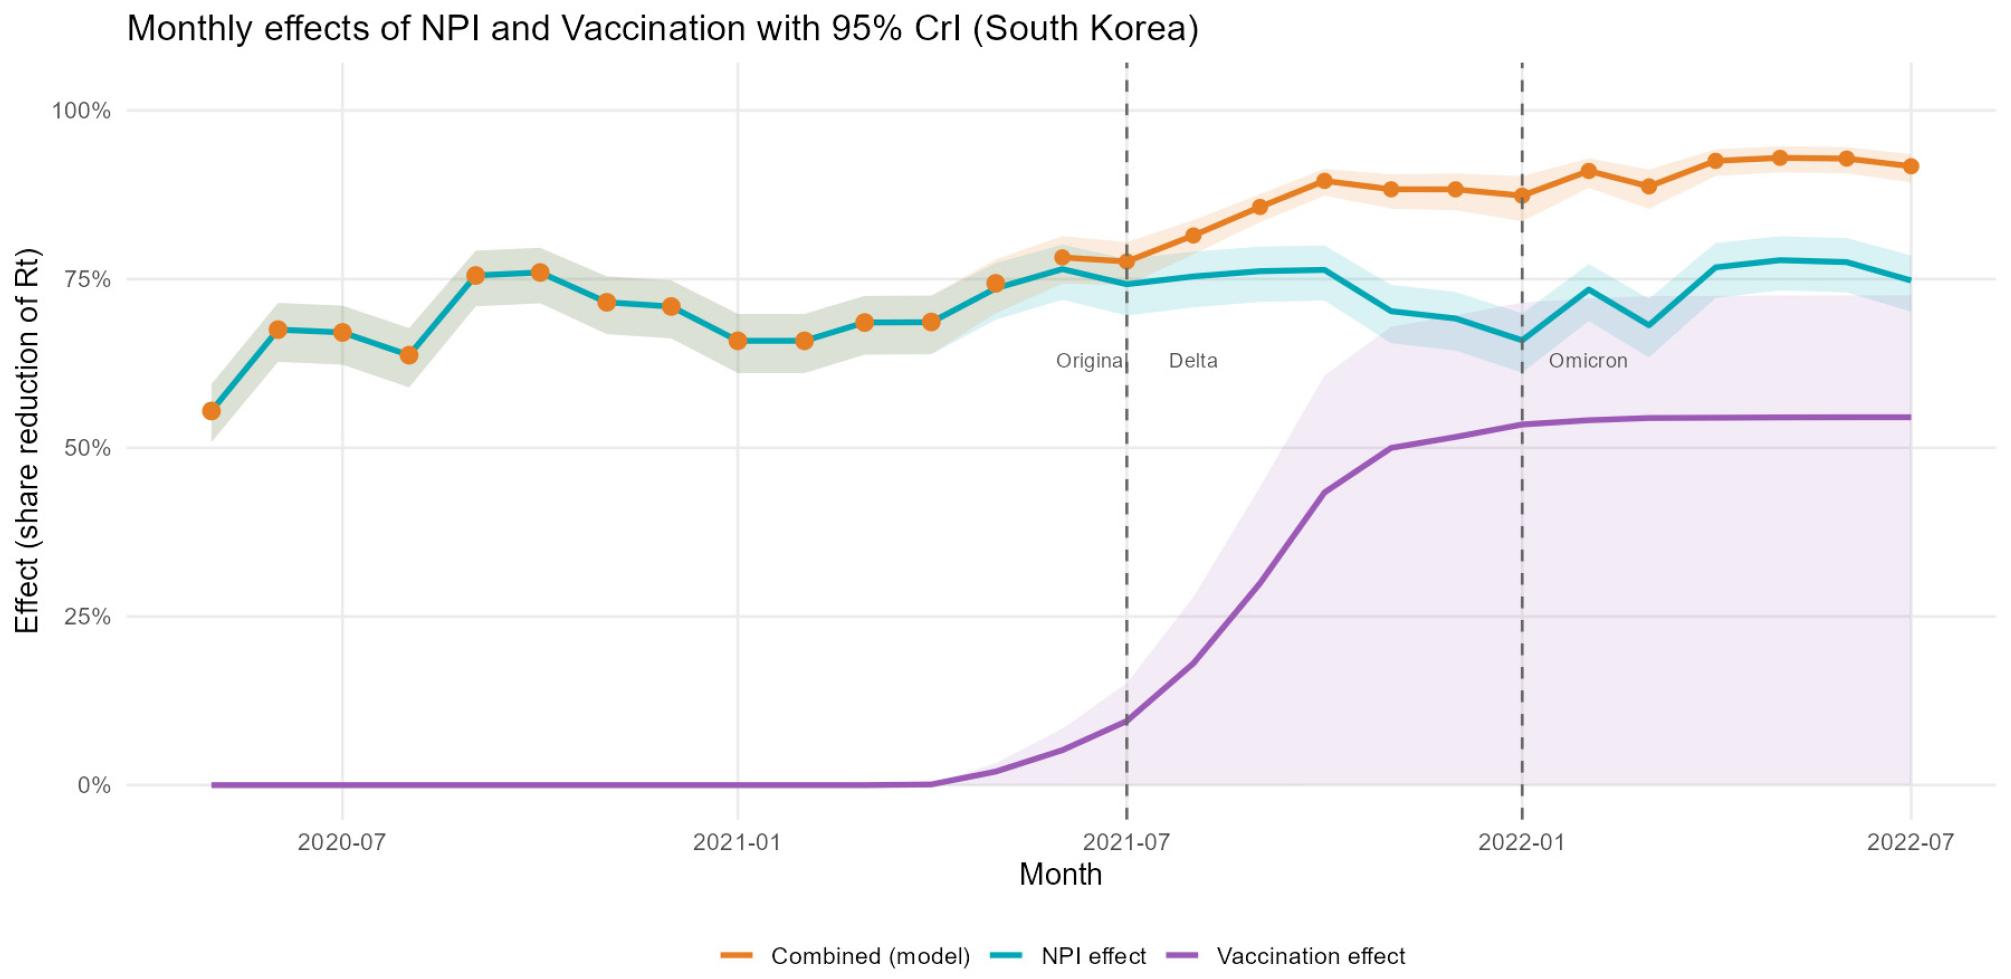
Fig. 1
Monthly effects of NPIs and Vaccination in South Korea. Blue line: effects of NPI. Purple line: effects of vaccination. Orange line: combined effects of NPI and vaccination.
Table 2.
Posterior median and 95% CrI of reduction effects of NPI, vaccination, and in combination
Notably, the observed effectiveness of NPIs did not exhibit a strong correlation with the tier numbers of the official social distancing policy (35). Even after November 2021 when South Korea transitioned their social distancing strategy to “ Stepwise Restoration of Daily Life” and relaxed stringent physical distancing measures, the combined impact of interventions did not show a marked decline. This resilience is attributed to core measures that maintained low sensitivity to official distancing tiers, such as universal mask mandates, restrictions on gathering sizes, and limitations on business operating hours.
The contribution of vaccination to transmission reduction began at 0.1% (CrI:0.0 – 0.17) in April 2021 and demonstrated a consistent upward trajectory (Fig. 1). A sharp increase was observed through November 2021, followed by a more gradual rise, eventually reaching 54.5% (CrI:0.0 – 72.6) by July 2022.
The interactive effect of NPIs and vaccination started at 68.7% (CrI:63.9 – 72.6) upon the initial rollout of vaccines in April 2021 and followed a steady upward trend. By July 2022, the integrated impact of both interventions was quantified at 91.7% (CrI:89.3 – 93.5). These findings underscore the critical role of the combinatory interaction between pharmaceutical and non-pharmaceutical strategies in controlling the epidemic trajectory within the South Korean context.
Observations and Analysis of Epidemic Waves
The time-varying reproduction number () estimated via the Bayesian model generally fluctuated near the epidemic threshold () (Fig. 2). However, several pronounced spikes exceeding this threshold were observed, corresponding to the “waves” of the pandemic in South Korea. These spikes align with the epidemiological definition of a wave, characterized by a sustained period where > 1. Specifically, the first and second major spikes were observed in August 2020 and November 2020, respectively, followed by subsequent surges in July 2021 and January 2022. These temporal patterns are highly consistent with the previously documented wave trajectories in South Korea (24).
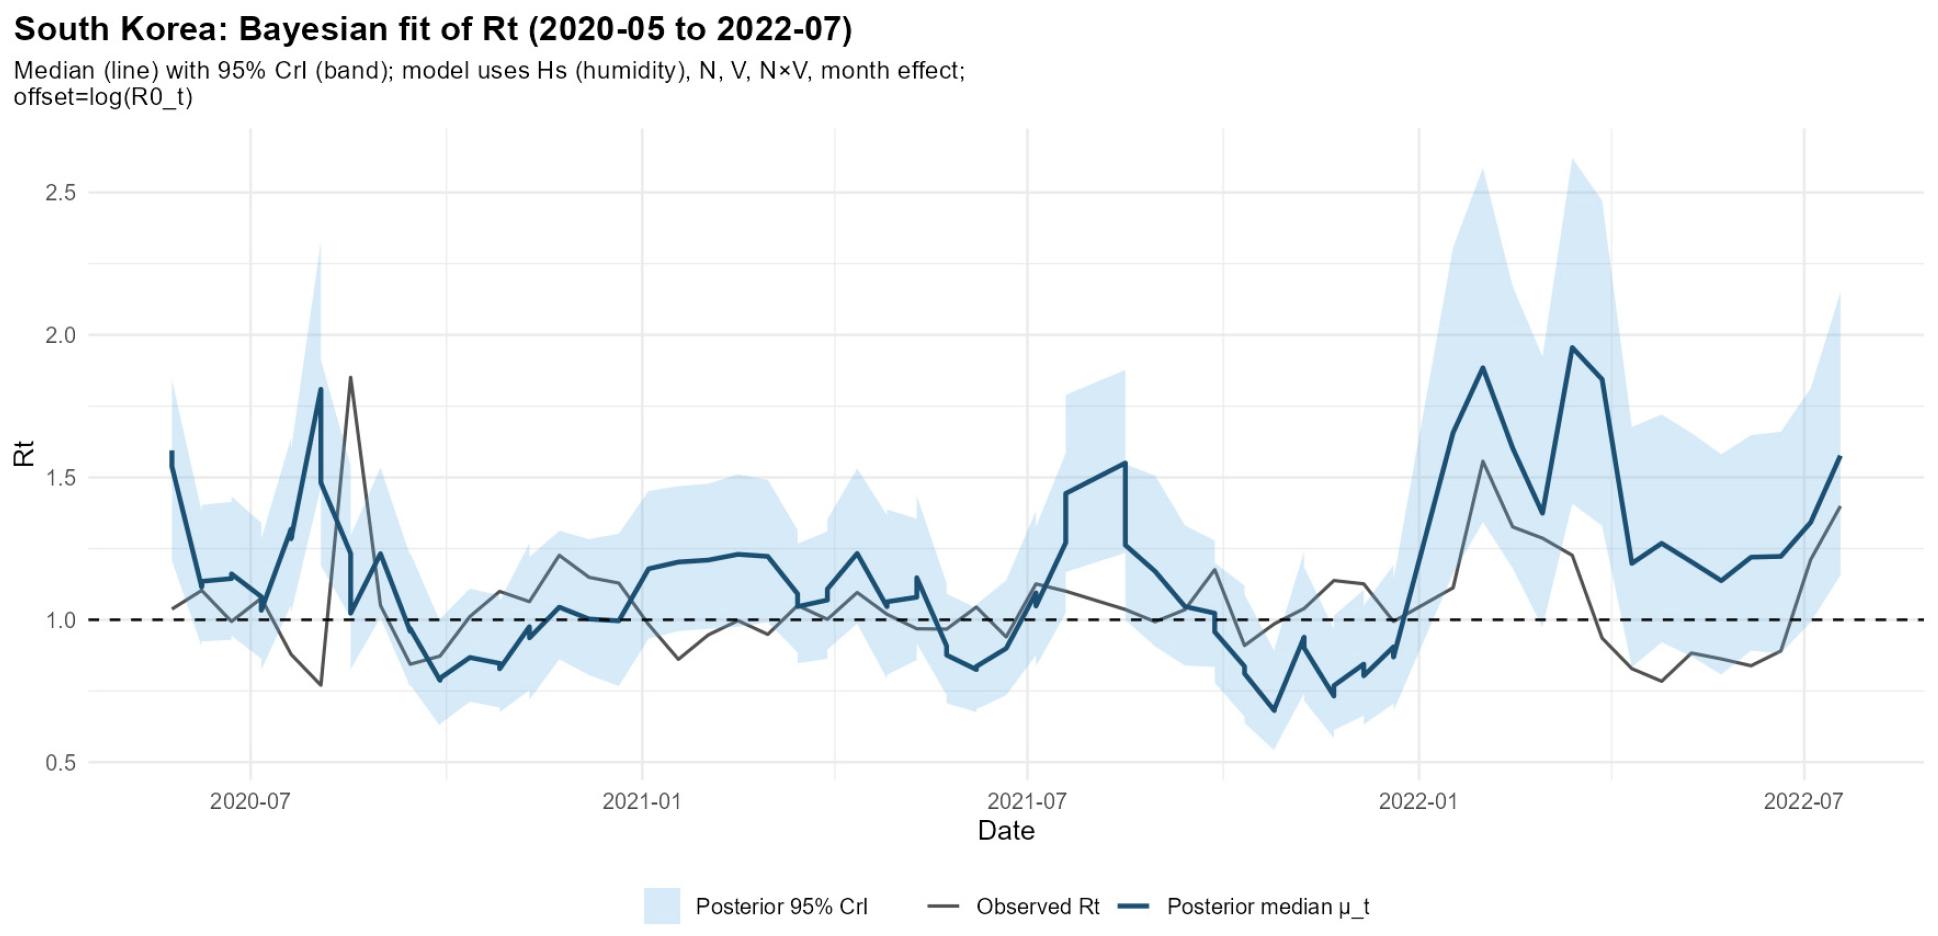
Fig. 2
2021.05 – 2022.07 based on Epiestim or Bayesian Inference. Dark blue line: Median of estimated via the Bayesian model. Light blue section: 95% CI of Bayesian estimation. Black line: estimated via EpiEstim. Dashed line: the threshold line y=1 marking the minimum required for continuation of epidemics.
Comparison with EpiEstim and Uncertainty Analysis
calculated using the EpiEstim package reflects short-term fluctuations driven by the number of daily confirmed cases. Significant discrepancies between the EpiEstim estimates and the Bayesian model predictions were observed during mid-2020 and early 2022. In mid-2020, EpiEstim showed a rapid escalation in transmission rates, whereas the Bayesian model exhibited a more constrained increase. This suggests that while the Bayesian model accounted for the stringent NPIs and seasonal climatic variables (e.g., summer humidity), it may have relatively underestimated the localized surge in cases during that specific period. During the emergence of the Omicron variant in early 2022, the Bayesian model recorded a sharp increase in . Notably, the 95% Credible Interval (CI) expanded significantly during this phase. This widening of the CI reflects the increased complexity and diversification of intervention factors, which introduced higher degrees of uncertainty into the model’s parameters.
Impact of Control Variables
Our findings indicate that relative humidity and other latent factors exerted a marginal influence on the transmission dynamics of SARS-CoV-2 compared to the primary interventions.
Figure A illustrates the estimated effect of humidity, which fluctuated between the posterior median of -6.6% and 6.2% (Fig. 3). This variable exhibited distinct seasonal trends, reflecting the temporal variations in environmental conditions. Figure B presents the impact of residual factors, which remained near zero, ranging from the posterior median of -1.0% to 0.6%. Notably, these factors were characterized by a markedly wide 95% Credible Interval (CI), indicating high statistical uncertainty.
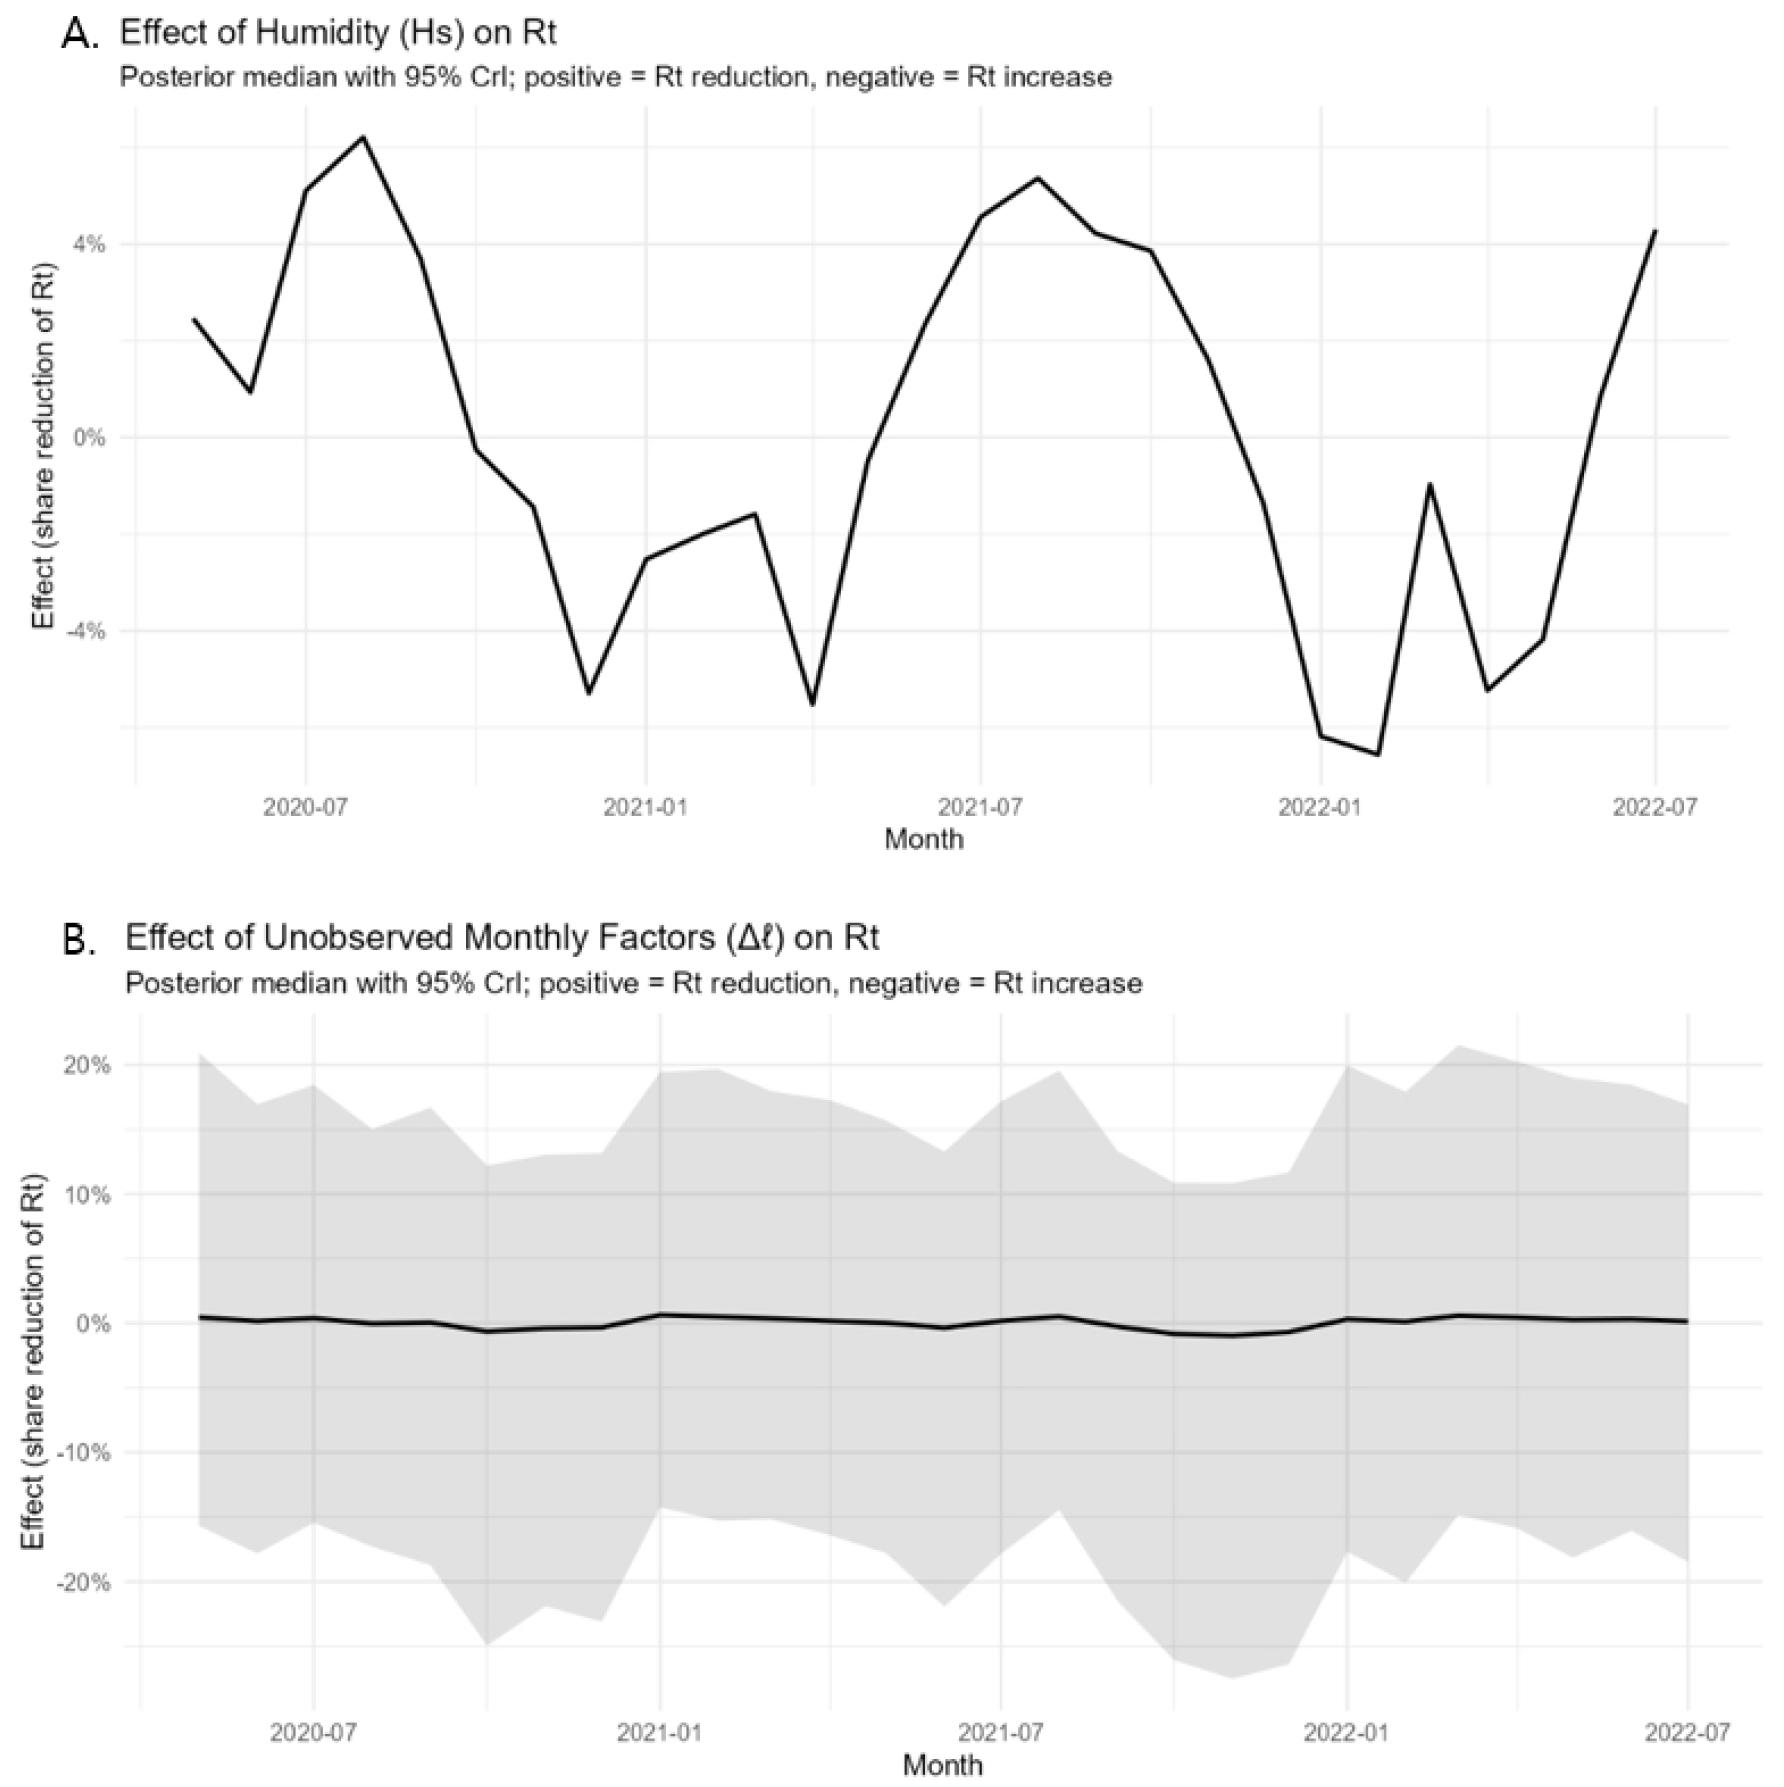
Fig. 3
The effect of humidity and residual monthly factors in South Korea. Figure A. Effect of Humidity by month. Figure B. Effect of other factors by month.
In summary, NPIs and vaccination accounted for most of the observed reduction in SARS-CoV-2 transmission. Humidity played a secondary role, and other factors contributed only minimally with a high degree of uncertainty. These results reinforce the conclusion that direct public health interventions were the primary drivers in modulating the epidemic trajectory in South Korea.
The robustness and predictive performance of the Bayesian model were validated using Markov Chain Monte Carlo (MCMC) diagnostics and Pareto Smoothed Importance Sampling Leave-One-Out (PSIS-LOO) cross-validation. Through MCMC sampling, we achieved an R-hat value of less than 1.1 for all parameters, indicating successful convergence across chains. Furthermore, the effective sample size () for all variables remained within a stable and sufficient range to ensure reliable posterior estimates. A negative correlation was observed between the coefficients and . This correlation suggests that the model’s estimation of the combined effect of NPIs and vaccination possesses higher statistical reliability and persuasive power than the individual assessment of each component alone. This finding underscores the importance of interpreting these interventions as an integrated public health strategy.
The PSIS-LOO diagnostic results showed all Pareto-k values to be below 0.7. ELPD_loo was -5.2 (SE 2.1), and LOOIC was calculated at 103.9 (SE 4.2).
A 7-day lag to the NPI index suggested that the main conclusions in the study are not driven by contemporaneous overlap between the NPI index and .
DISCUSSION
Comparative Analysis: South Korea vs. 31 European Nations
Our findings reveal that as of October 2021, the combined effectiveness of NPIs and vaccination in South Korea was 89.6% (CrI: 87.4 – 91.4), significantly higher than the 53% reported for 31 WHO European Member States (8) (Fig. 4). Specifically, the isolated NPI effect in South Korea was 76.4% (CrI:71.8 – 80.0) (2.12 times higher than European regions), and the vaccination effect was 43.4% (CrI:0.0 – 60.7) (1.14 times higher than European regions). Notably, while the efficacy of NPIs in Europe reportedly declined by 12% following the rollout of vaccines, South Korea maintained a stable level of NPI effectiveness. These results underscore that both pharmaceutical and non-pharmaceutical interventions were more potent in limiting the transmission of SARS-CoV-2 in South Korea than in the European context.
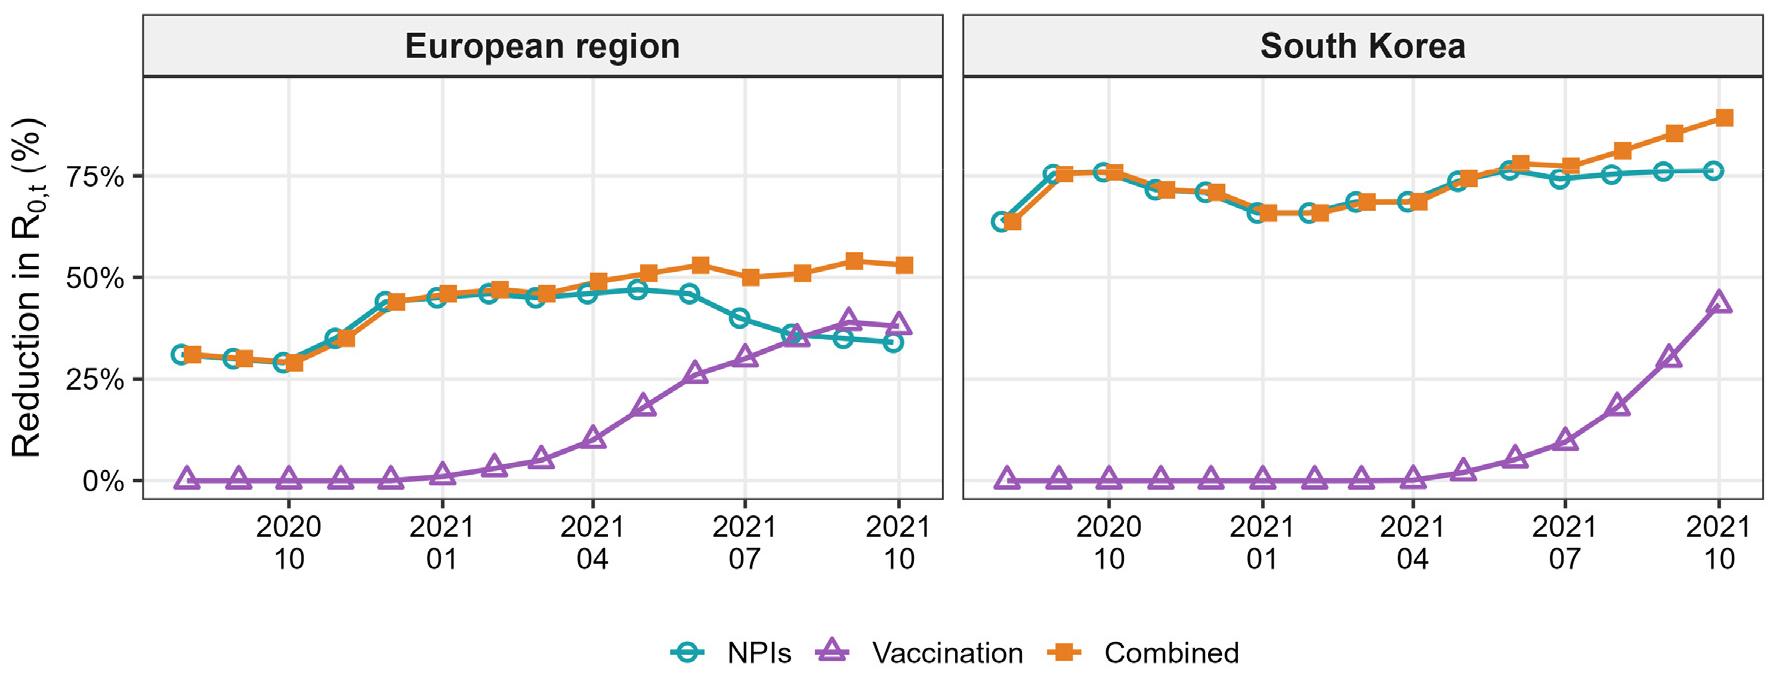
Fig. 4
Effects of NPI and Vaccination in European WHO Member States and South Korea. Blue line: Effect of NPI. Purple line: Effect of vaccination. Orange line: Combined effect of NPI and vaccination.
This disparity aligns with previous analyses suggesting that the high level of public compliance with health policies in East Asia leads to superior NPI efficacy compared to Western nations (6). Public adherence is intrinsically linked to the structural efficiency of the social system, such as the robust tracking test system on susceptible members. Furthermore, the observation that NPI sustainability and policy compliance may exert a greater influence than the specific vaccine type is supported by the fact that the transition periods to mRNA-based vaccines (e.g., Moderna, Pfizer) were not prolonged in most European contexts compared to South Korea (8).
In South Korea, the effectiveness of these interventions remained largely resilient to shifts in dominant variants or adjustments in the stringency of social distancing tiers. The sustained impact of NPIs post-vaccination, as corroborated by Le Duc Huy et al., indicates that these two policy arms functioned complementarily rather than exclusively (9). The negative correlation observed between the coefficients 𝛽 and 𝜆 further supports the existence of a combined effect. The combined effectiveness was found to be more than 10% higher than the isolated effect of vaccination alone, reinforcing the necessity of an integrated approach (5).
However, our analysis remains inconclusive regarding the extent to which the emergence of new variants, fluctuating vaccination rates, and the accumulation of natural immunity through infection may have independently influenced NPI efficacy (3).
Methodological Strengths: Bayesian vs. EpiEstim
A comparative review of the Bayesian model and EpiEstim highlights distinct analytical strengths. During the surge of the Omicron variant in January 2022—characterized by a decline in new vaccinees and the easing of NPIs—the Bayesian estimates exhibited reduced precision (widened credible intervals). While EpiEstim provides intuitive metrics based on observed case counts, our Bayesian framework enables a comprehensive interpretation by synthesizing multiple socio-environmental factors, thereby offering a more nuanced understanding of the epidemic trajectory.
Limitations of this research
Limitations of the Reproduction Number
The estimation of is inherently constrained by its sensitivity to numerous unobservable variables, which complicates the modeling of scenarios where no interventions are present. Furthermore, as effective reproduction number () estimates vary significantly depending on the underlying computational methodology, a degree of epistemic uncertainty remains regarding its absolute precision.
Representation of NPIs
While the OxCGRT indices facilitate cross-national comparisons, they may lack the granularity required to precisely capture the nuances of internal policy shifts within a single country. South Korea utilized a tiered “Social Distancing” system that integrated multiple heterogeneous measures; however, our current methodological framework may not fully account for these intricate policy variations. Future research should pursue more refined approaches to better reflect the specific epidemiological data structures unique to the South Korean context.
Vaccination Data Constraints
Several simplifications were made regarding vaccination data due to data availability. First, the protective effects of a single dose and heterologous (mix-and-match) dosing were not explicitly modeled. The latter was excluded primarily due to a lack of detailed KDCA records specifying the exact combinations of vaccines used in cross-vaccination. Additionally, the impact of booster doses (third dose and beyond) was not incorporated into the current analysis, which may influence the long-term effectiveness estimates.
Statistical Robustness
Regarding the MCMC diagnostics, the R-hat and for the parameter exhibited slightly lower stability compared to other variables. However, in line with established literature, this minor fluctuation did not appear to exert a significant impact on the overall modeling process or the integrity of the results (8).
The real-world effectiveness of vaccination in 2022 may be somewhat lower than the estimates derived from our Bayesian model due to the waning effectiveness of real-world vaccination.
CONCLUSION
The efficacy of pandemic countermeasures, specifically Non-Pharmaceutical Interventions (NPIs) and vaccination, is intrinsically modulated by individual policy compliance and the structural efficiency of social systems.
Our findings underscore that while NPIs and vaccination operate in a combinatory manner, NPIs remain a critical primary tool for pandemic control, particularly in its nascent stages. Throughout the study period, NPIs consistently contributed between 50% and 75% to the reduction of SARS-CoV-2 transmission, even in the absence of a vaccination framework.
Furthermore, the data suggest that the initiation of a vaccination campaign does not justify the premature de-escalation (lifting) of NPIs. Relaxing these measures prematurely appears to hinder, rather than accelerate, the termination of the pandemic. These results emphasize that a sustained, dual-track approach—integrating robust public health mandates with pharmaceutical advancements—is essential for the effective management and eventual resolution of global pandemics.
