

INTRODUCTION
Acute respiratory viruses (ARVs), including influenza virus (IFV), adenovirus (ADV), parainfluenza virus (PIV), respiratory syncytial virus (RSV), human metapneumovirus (hMPV), rhinovirus (hRV), human bocavirus (hBoV), and human coronaviruses (hCoVs), are leading causes of respiratory infections across all age groups. These pathogens drive seasonal epidemics and recurrent outbreaks, creating substantial clinical and socioeconomic burdens (1). Continuous surveillance of ARVs is therefore a cornerstone of public health preparedness.
In South Korea, sentinel surveillance coordinated by the Korea Disease Control and Prevention Agency (KDCA) has been the primary tool for monitoring ARV activity (2). While sentinel systems provide valuable data on epidemic trends, they are limited by dependence on healthcare utilization, reporting delays, and incomplete population coverage. These constraints highlight the need for complementary approaches that can strengthen early detection and outbreak response.
Wastewater-based epidemiology (WBE) has emerged as a promising alternative. Many respiratory viruses are shed not only via respiratory secretions but also through the gastrointestinal tract, making wastewater an integrated matrix that reflects infections among both symptomatic and asymptomatic individuals (3, 4, 5). WBE enables population-level surveillance independent of clinical testing, addressing underdiagnosis, healthcare disparities, and reporting lags.
During the COVID-19 pandemic, WBE proved effective worldwide as a real-time indicator of SARS-CoV-2 transmission (6, 7, 8), and successful networks were also established in South Korea (9). Recently, international studies have expanded WBE to other ARVs (10, 11). However, applications of WBE for ARVs in Korea remain scarce, with national frameworks still relying heavily on sentinel data.
This study aimed to quantitatively compare wastewater detections with national sentinel surveillance data across eight major ARVs to evaluate how well wastewater signals reflect community-level respiratory virus activity. By assessing virus-specific temporal concordance, we sought to identify ARVs, such as hMPV, PIV, and IFV, may serve as priority targets in future wastewater surveillance systems.
MATERIALS AND METHODS
Sample collection
From September 2023 to August 2024, influent (raw) wastewater samples (n = 295) were collected weekly from six wastewater treatment plants (WWTPs) in Busan, South Korea, as summarized in Table 1. At each site, a 1 L grab sample of influent was collected into a sterile sampling bottle, placed immediately on ice, and transported in insulated coolers to the laboratory within 24 h. Prior to subsampling, bottles were gently inverted to homogenize the matrix. From each bulk sample, a 40 mL aliquot was aseptically transferred into sterile polypropylene tubes (SPL Life Sciences, Gyeonggi-do, Korea) for downstream viral concentration. All samples were stored at 4°C until processing.
Table 1.
Characteristics of wastewater treatment plants (WWTPs) and sampling summary, Busan, South Korea (2023–2024)
Physicochemical Analysis
The pH and electrical conductivity of each sample were measured using a Pro DSS multiparameter instrument (YSI Inc., OH, USA) at the time of collection.
Viral Concentration and Nucleic Acid Extraction
Wastewater samples were processed for viral concentration and nucleic acid extraction using a KingFisher APEX automated system (Thermo Fisher Scientific, Waltham, USA) with the iMag™ Virus Enrichment & Ultra Nucleic Acid Purification Kit (SNC, Seoul, Korea). A 40 mL aliquot of influent wastewater was centrifuged at 4,000 × g for 10 min at 4°C using a Union 32R Plus refrigerated centrifuge (Hanil Science Industrial Co., Ltd., Incheon, Korea) to remove suspended solids. The clarified supernatant was then concentrated to 1,600 µL by magnetic-bead capture per the manufacturer’s protocol, and total nucleic acids were purified to yield 100 µL of eluate. Eluates were used directly for real-time RT-PCR or stored at 4°C for ≤24 h or at −80°C for longer-term storage.
Real-time RT-PCR detection and subtyping
Eight ARVs were assayed: IFV A/B, ADV, hMPV, RSV A/B, PIV-1/3, hRV, and hCoVs 229E/OC43/NL63. Detection used PowerCheck™ real-time PCR/RT-PCR kits (Kogene Biotech, Seoul, Korea) on a 7500 Real-Time PCR System (Applied Biosystems, Thermo Fisher Scientific, Waltham, USA) with cycling conditions of 50°C for 15 min, 95°C for 2 min, and 45 cycles of 95°C for 15 s and 60°C for 60 s. A sample was considered positive when duplicate reactions amplified with Ct < 40. Subtype summaries for IFV (A/B) and PIV (1, 2, 3) followed the corresponding multiplex kits from the same manufacturer.
Sentinel surveillance data
Clinical surveillance data for acute respiratory viruses were obtained from the national sentinel surveillance system operated by KDCA. Because city-level data specific to Busan were not publicly available, nationwide weekly case metrics were used for correlation analysis despite Busan serving ~7% of Korea’s population (3.4 million). As the second-largest city, Busan WBE contributes significantly to Korea Wastewater-based Surveillance (KOWAS) signals and serves as validated urban proxy for nationwide trends in Korean SARS-CoV-2 surveillance (12). ARV activity was represented as the weekly number of suspected cases (estimated cases) reported by nationwide sentinel medical institutions, while influenza virus activity was expressed as the number of influenza-like illness (ILI) cases per 1,000 outpatient visits. These surveillance data included the same ARV targets as those analyzed in the wastewater assays, enabling direct comparison of temporal trends.
Data Analysis
All statistical analyses were performed using Microsoft Excel 2021 (Microsoft Corp., Redmond, USA). For each virus, the weekly wastewater outcome was defined as the number of WWTPs testing positive among those sampled that week (range 0–6); monthly values were obtained by summing weekly counts. For descriptive reporting, detection rates (%) were also calculated as (weekly positives / number of WWTPs sampled that week) × 100. Quantitative viral loads were omitted due to frequent near-LoD fluctuations during inter-epidemic periods; prior WBE studies validate the use of viral RNA concentrations and related detection metrics, including presence/absence or detection rates, for correlating wastewater signals with clinical trends in respiratory viruses (10, 13). Associations between sentinel surveillance case numbers and wastewater detections were quantified using Pearson’s correlation coefficient (r) calculated with CORREL; two-tailed p-values (α=0.05) were derived from the t statistic using T.DIST.2T. Correlation strength was interpreted as strong (|r| ≥ 0.7), moderate (0.5–0.7), weak (0.3–0.5), and poor (< 0.3), consistent with Table 2.
Table 2.
Pearson correlation coefficients (r) between wastewater detections and national sentinel surveillance, Busan, 2023–2024
RESULTS
Physicochemical Characteristics of Wastewater
pH values were similar across WWTPs (means 6.77–7.04; Table 1), whereas electrical conductivity (EC) varied substantially (799–11,139 µS/cm), with the highest mean at Jungang WWTP and the lowest at Haeundae WWTP, reflecting differences in local wastewater composition.
Detection of Acute Respiratory Viruses in Wastewater
Among 295 samples, 267 (90.5%) tested positive for at least one of the eight target viruses, yielding 611 detections including co-detections (Table 3). ADV showed the highest positivity rate (81.4%), followed by hBoV (41.0%), IFV (27.8%), and RSV (22.0%). hMPV and PIV were detected in 19.0% and 11.9% of samples, respectively, whereas hRV (2.4%) and hCoV (1.7%) were infrequent.
Table 3.
Detection of acute respiratory viruses in wastewater samples (n=295) No. of detections (Detection rate, %)
| Category. |
No. of samples | No. of detections (total)* | No. of Detected virus (% of total samples) | |||||||
|---|---|---|---|---|---|---|---|---|---|---|
| ADV | PIV | RSV | IFV | hCoV | hRV | hBoV | hMPV | |||
| Total | 295 | 611 |
240 (81.4) |
35 (11.9) |
65 (22.0) |
82 (27.8) |
5 (1.7) |
7 (2.4) |
121 (41.0) |
56 (19.0) |
Geographic variation was observed among WWTPs: Haeundae showed the highest number of detections, particularly for ADV and hBoV, while Gangbyeon exhibited the lowest positivity, possibly due to industrial wastewater inputs affecting RNA stability (Table 1).
Temporal Trends in Wastewater Detection
Weekly temporal trends in wastewater detections and national sentinel surveillance are shown in Fig. 1. ADV and hBoV were consistently detected throughout the year, indicating persistent circulation. ADV and hBoV were consistently detected throughout the year, indicating persistent circulation. PIV showed a distinct spring peak (weeks 12–18). IFV was primarily detected from week 42 (2023) to week 6 (2024), with influenza A dominating early and influenza B increasing later. hMPV peaked sharply between weeks 10–15 of 2024, coinciding with the national epidemic. RSV rose in sentinel data from week 49 (2023) to a peak at week 4 (2024). In wastewater, RSV was first detected in week 44 (2023), found at five WWTPs by week 6 and all six by week 12, but disappeared after week 25. hRV and hCoV were detected only sporadically (five and seven detections, respectively) without clear seasonality.
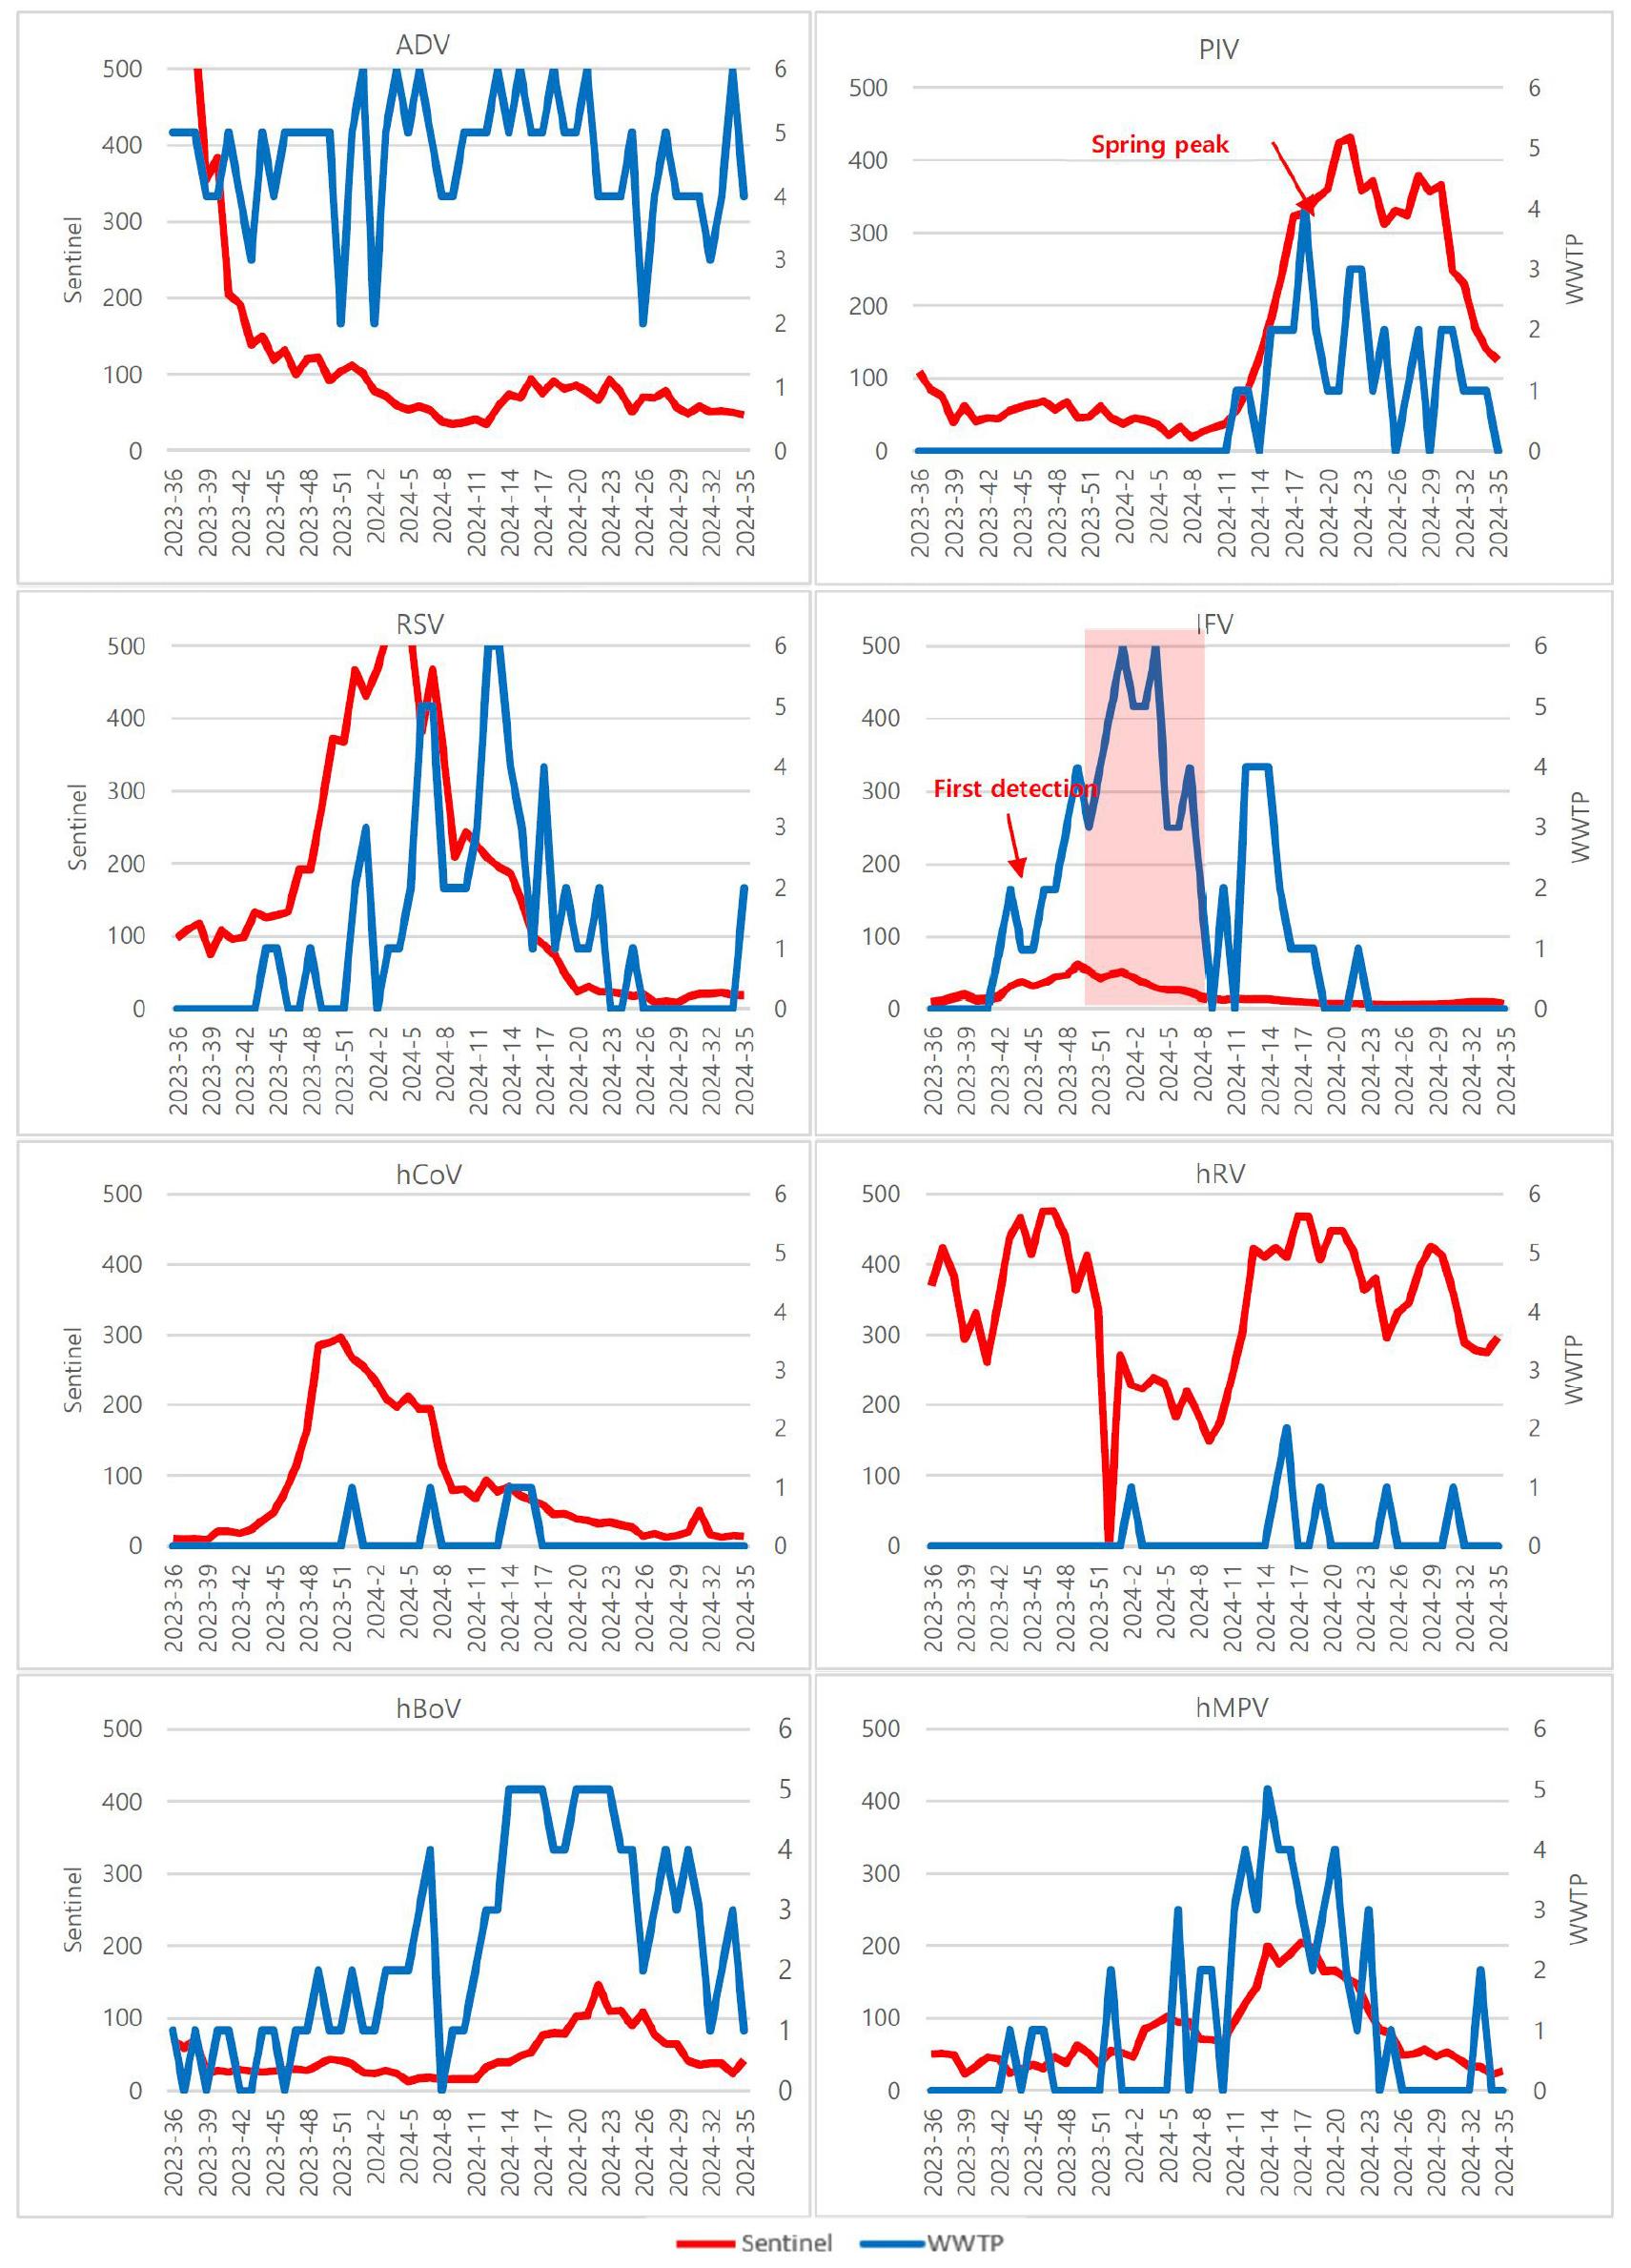
Fig. 1
Weekly temporal trends of ARV cases from sentinel surveillance (red lines) and wastewater detections (blue bars) in Busan, South Korea, September 2023–August 2024.
Note: Wastewater from Busan WWTPs (n=6) vs. national sentinel data (geographic mismatch acknowledged). Dual y-axes: left=sentinel cases, right=WWTP positives (0-6). Key peaks annotated: IFV winter (2023-52/2024-1~6), hMPV spring (2024-10~15), PIV spring (2024-12~18), RSV winter (2023-50~2024-4).
Subtype- and Type-Specific Findings
Distinct subtype/type distributions were Subtype- and type-specific detection patterns are summarized in Table 4. IFV yielded 82 detections—74 influenza A and 33 influenza B—with peaks at week 52 (2023) and week 1 (2024), matching the national epidemic pattern. PIV detections (n = 35) were dominated by PIV-3 (PIV-1, n = 2; PIV-2, n = 0; PIV-3, n = 34), first appearing in week 12 (2024), peaking in April, and declining after July. RSV detections were skewed toward RSV-B (n = 59) compared with RSV-A (n = 11).
Table 4.
Subtype-specific detection of influenza virus and parainfluenza virus in wastewater (Busan, 2023–2024)
| Virus | Subtype |
No. of detections | Peak detection period | Epidemiological notes |
|---|---|---|---|---|
| IFV | A | 74 |
Week 52/2023, 1/2024 (winter) | Early-season dominance |
| B | 33 | Weeks 1–6/2024 (winter) | Increased later in season | |
| Total IFV | — | 82* | Weeks 52/2023, 1/2024 | Shift from A→B |
| PIV | PIV-1 | 2 | Weeks 12–18/2024 (spring) | Sporadic |
| PIV-2 | 0 | — | Not detected | |
| PIV-3 | 34 |
Weeks 14–23/2024 (Apr–Jun; spring) | Major contributor | |
| Total PIV | — | 35* | Spring 2024 | Predominantly PIV-3 |
| RSV | RSV-A | 11 |
Weeks 49/2023–6/2024 (winter) | Sparse wastewater signal |
| RSV-B | 59 |
Weeks 49/2023–13/2024 (winter) | Higher wastewater detections | |
| Total RSV | — | 65* | Winter 2023–2024 |
WWTP elevations at wks 6–7, 12–13/2024 |
Correlation with Clinical Surveillance Data
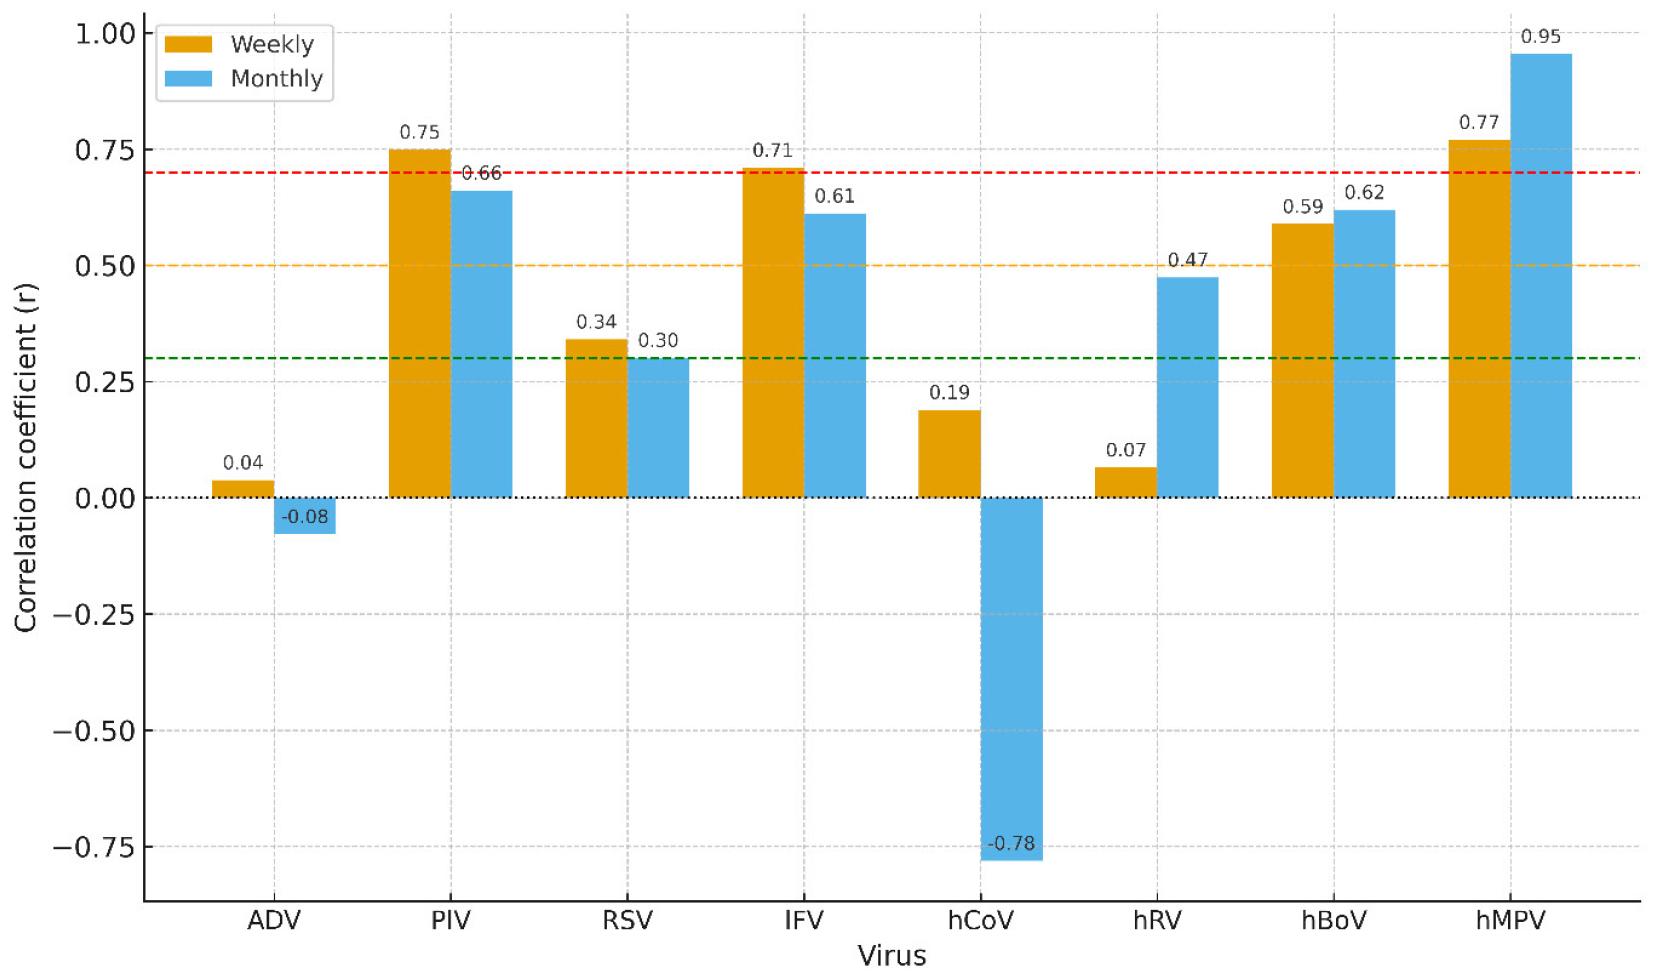
Wastewater viral signals showed varying degrees of concordance with national sentinel data (Fig. 2; Table 2). The strongest correlations were observed for hMPV, followed by PIV and IFV. For hMPV, correlations were strong at both resolutions (weekly r = 0.770; monthly r = 0.955). PIV showed slightly higher correlations than IFV (weekly r = 0.749; monthly r = 0.661 vs. IFV weekly r = 0.710; monthly r = 0.612). hBoV displayed moderate associations (weekly r = 0.589; monthly r = 0.620). In contrast, RSV correlations were weak (weekly r = 0.341; monthly r = 0.301), reflecting limited wastewater detections despite a clear winter peak in sentinel data. ADV and hRV correlations were poor weekly (r = 0.038 and 0.065, respectively), though hRV improved to weak monthly (r = 0.474). hCoV correlations were poor (weekly r = 0.189) or negative (monthly r = −0.781); given its low positivity, these should be interpreted cautiously. Overall, monthly aggregation tended to enhance correlations for viruses with highly variable weekly signals (e.g., hMPV, hBoV), whereas IFV and PIV showed stronger correlations at finer temporal resolution, indicating that their wastewater signals were more closely aligned with sentinel data on a weekly timescale.
DISCUSSION
This study demonstrated the applicability of WBE for ARVs. By analyzing 295 wastewater samples collected from six major treatment plants in Busan over one year, we confirmed that wastewater viral detection patterns closely reflected community-level circulation of respiratory pathogens. Eight ARVs were monitored, among which the DNA viruses ADV (81.4%) and hBoV (41.0%) were consistently detected throughout the year, while IFV (27.8%), PIV-3 (11.9%), and hMPV (19.0%) exhibited pronounced seasonality. These findings indicate that WBE can capture both the long-term persistence of environmentally stable or chronically shed viruses and the epidemic peaks of seasonally driven pathogens.
A central finding was the strong agreement between wastewater signals and national sentinel surveillance for hMPV, PIV, and IFV (Fig. 2; Table 2). The highest correlations were observed for hMPV (weekly r = 0.770; monthly r = 0.955), followed by PIV (weekly r = 0.749; monthly r = 0.661) and IFV (weekly r = 0.710; monthly r = 0.612). These results align with previous studies reporting that wastewater viral dynamics can mirror clinical surveillance data and complement conventional monitoring systems (13, 14). In particular, the close temporal concordance between wastewater hMPV and PIV signals and national epidemic peaks underscores the potential of WBE as a near–real-time indicator of respiratory virus activity (15).
Wastewater surveillance also captured subtype- and type-specific epidemiological shifts. For influenza, wastewater data reflected not only the overall epidemic peak but also the transition from influenza A predominance in late 2023 to increasing influenza B activity in early 2024, consistent with sentinel observations.
In contrast, parainfluenza virus was detected in a total of 35 samples. Among the three subtypes tested (PIV-1, PIV-2, and PIV-3), PIV-2 was not detected, PIV-1 was identified in two samples, and PIV-3 in thirty-four. One case represented a co-detection, accounting for the discrepancy between subtype counts and the total number of detections. PIV-3 is known to circulate mainly during spring and early summer in temperate regions. Consistent with this pattern, the present study first detected PIV-3 in week 12 of 2024, after which detections steadily increased, peaking in April and declining after July. This seasonal trend aligns with previous reports (14, 15) and supports the potential utility of wastewater-based surveillance as an effective tool for tracking the circulation of parainfluenza viruses in the community.
These subtype-specific patterns collectively suggest that WBE can provide epidemiologically meaningful resolution, while underscoring that not all subtypes are equally detectable in wastewater matrices.
In contrast, RSV and hCoV showed limited correlations between wastewater and sentinel data (15). RSV exhibited a distinct winter epidemic in clinical reports but was detected only transiently in wastewater, likely due to factors such as lower viral shedding in feces, RNA instability, and dilution effects from precipitation. hCoV displayed very low wastewater positivity, resulting in poor or negative correlations with clinical trends. These findings highlight inherent differences in viral shedding dynamics and environmental stability that influence detectability in WBE systems.
Wastewater outcomes used detection counts/rates rather than quantitative loads, as ARV RNA frequently fluctuates near LoD in inter-epidemic periods, causing titer variability (10). This aligns with WBE studies showing that wastewater viral signals, expressed as concentrations or detection metrics, can capture epidemic timing relative to clinical surveillance, particularly for respiratory viruses (10, 13). Strong correlations (hMPV/PIV/IFV, |r|≥0.7) confirm utility for outbreak detection where detections reliably track incidence peaks; however, weaker RSV/hCoV associations partly reflect binary loss of magnitude information and LoD threshold shifts (positive→negative via assay variability/dilution), potentially underestimating low-level transmission (10).
An important limitation is the geographic mismatch: wastewater from six Busan WWTPs (urban, ~3.4M population) was compared to national sentinel data, as city-specific ARV metrics are unavailable. Despite urban-rural differences potentially biasing concordance, strong correlations for hMPV/PIV/IFV (|r|≥0.7) validate Busan’s utility as national early-warning proxy within KOWAS framework, where regional signals aggregate to nationwide trends (12). Future multi-regional networks will refine spatial alignment.
Overall, this study reinforces the feasibility of wastewater-based surveillance as a complementary approach to traditional respiratory virus monitoring. Despite limitations such as restricted sampling frequency, lack of city-level clinical data for Busan, and potential degradation of viral RNA, our results demonstrate that WBE can effectively mirror epidemic trends and capture subtype-level information. Future research integrating quantitative viral load normalization, genomic sequencing, and environmental parameters will further enhance the temporal and spatial resolution of WBE. Collectively, these findings support the role of WBE as a scalable and near–real-time surveillance system for respiratory viruses, contributing to public health preparedness and early outbreak detection.
