

INTRODUCTION
Access to clean and safe drinking water is a key determinant of public health; however, millions of people around the world continue to encounter challenges in obtaining this essential resource. Water is essential for drinking, cooking, sanitation, and overall hygiene, making its quality a critical factor in preventing waterborne diseases. In the Philippines, well water remains a primary water source, particularly in rural and urbanizing communities. While generally considered safer than surface water due to natural filtration, groundwater is increasingly vulnerable to contamination from both natural processes and human activities (1). The rising demand for water, coupled with rapid urbanization, industrial expansion, and inadequate sanitation systems, further exacerbates pollution risks (2). Consequently, monitoring groundwater quality is essential to ensure public safety and sustainable development (2).
Among the various microbial contaminants in water sources, Aeromonas spp. have gained attention due to their pathogenic potential and environmental resilience. Aeromonas species are Gram-negative, facultative anaerobic bacteria commonly found in aquatic environments, including groundwater (3, 4, 5). While some strains play a role in wastewater treatment, others are opportunistic pathogens capable of causing gastroenteritis, wound infections, and septicemia, particularly in immunocompromised individuals (3, 4, 5). These bacteria possess virulence factors such as hemolysins, aerolysins, and enterotoxins, contributing to their pathogenicity (3, 6). In addition, Aeromonas spp. can persist in various environmental conditions, including low-nutrient settings, and have the ability to form biofilms, enhancing their survival in water distribution systems (7). The increasing antibiotic resistance observed in Aeromonas spp. further heightens public health concerns, as it limits treatment options and poses a challenge for infection control (8, 9, 10, 11).
Despite the significance of Aeromonas spp., data on their prevalence and antibiotic resistance profiles in well-water sources intended for drinking and domestic use in the Philippines remain scarce. Understanding their occurrence and resistance mechanisms is crucial given their ability to survive in treated water systems, form biofilms, and resist chlorination. Furthermore, the transmission pathway of pathogenic Aeromonas from water environments to humans is not yet fully understood. Baseline data on Aeromonas load and the dominant species present in well waters are also lacking, highlighting the need for a pilot investigation. Notably, most Aeromonas infections are linked to contact with contaminated water sources or the ingestion of food during farm-to-table operations (3, 5). Additionally, Khajanchi et al. (12) reported that water and clinical isolates shared similar virulence signatures, further suggesting the potential transmission of Aeromonas spp. from water to humans. To address these research gaps, we examined the prevalence, diversity, and antibiotic resistance patterns of Aeromonas spp. in well-water from selected barangays in Iloilo City. Additionally, we also assessed the heterotrophic bacterial count in the same water samples. The data generated may provide valuable insights for improving microbial water quality standards, enhancing public health protection strategies, and guiding future water management policies.
MATERIALS AND METHODS
Ethical approval
This study did not involve live animals; therefore, ethical approval was not required.
Sampling Sites
Water samples were obtained from community wells in five selected barangays in Iloilo City.
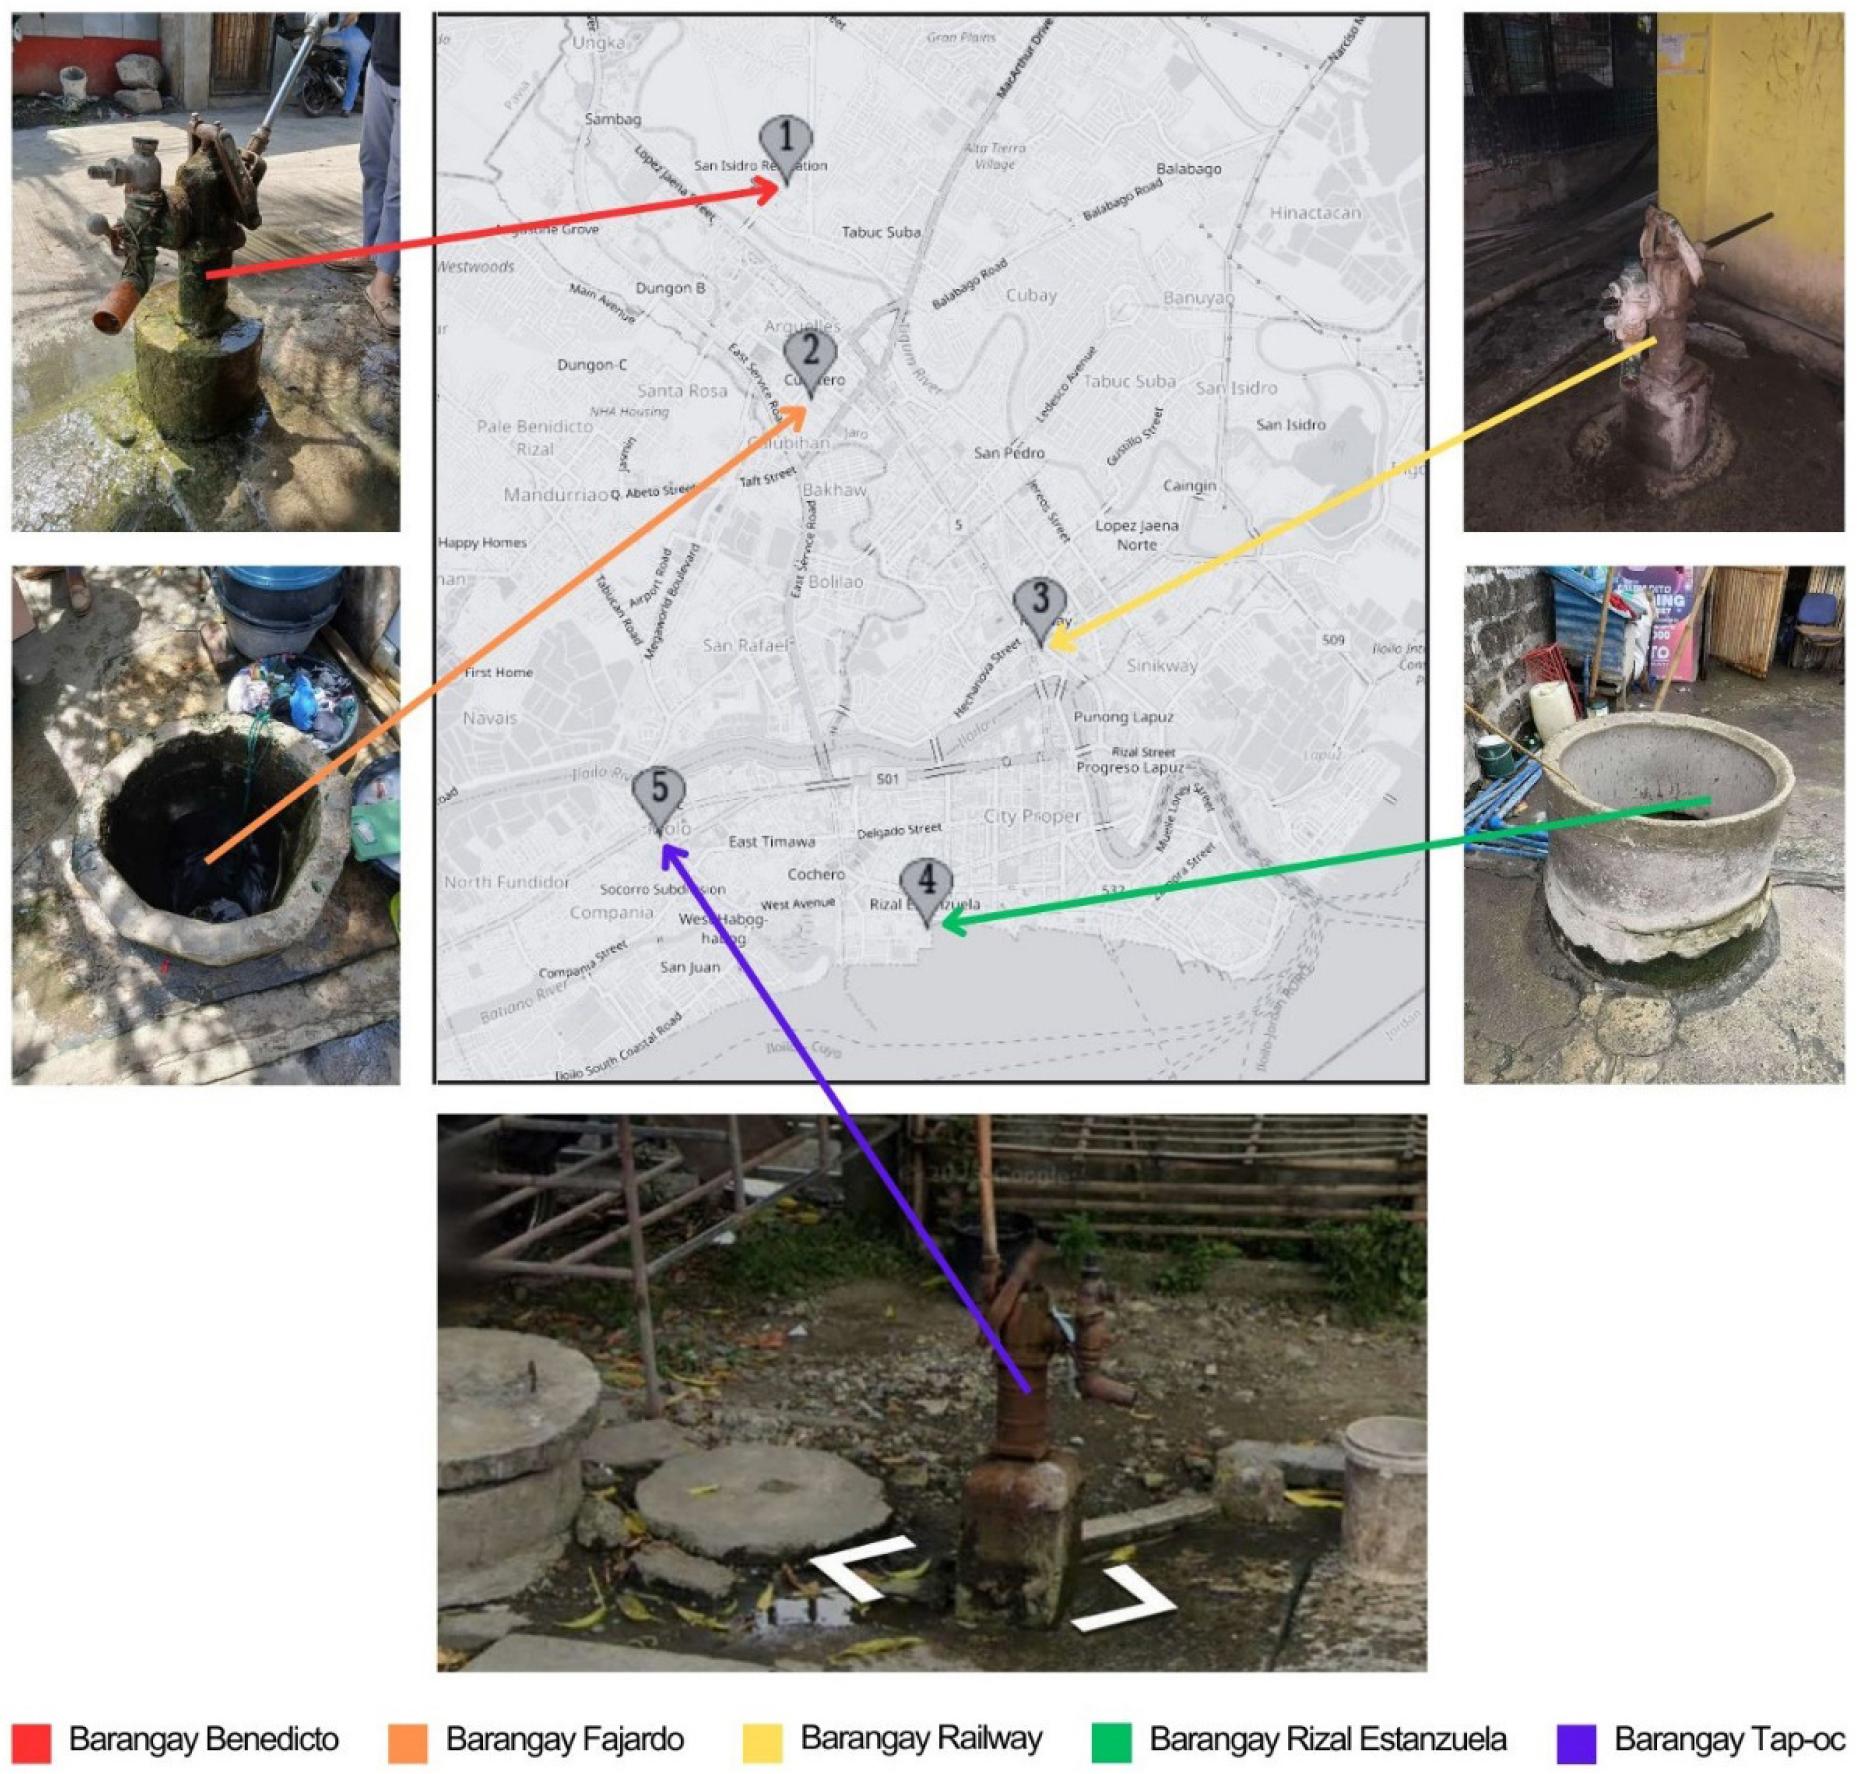
The sampling coordinates and photographs of the five selected wells examined in this study are provided in Table 1 and Fig. 1, respectively. These wells were chosen based on their accessibility and convenience, serving as vital water sources for the surrounding community. Residents rely on these wells not only for drinking water but also for various household activities such as cooking, cleaning, and laundry. Additionally, these wells are known for their consistent year-round water supply, ensuring their importance as dependable sources of water for the community.
Table 1.
Well number, location, sampling coordinates, and nature of well from five barangays (villages) of Iloilo City
Sample collection
Water samples for physicochemical and bacteriological analyses were collected from each well over five sampling periods at two-week intervals during both dry (March 7 to May 2) and wet (June 6 to August 1) seasons, respectively. Using sterile 500 mL glass bottles, water was aseptically obtained from each well following standardized procedures. For wells with hand pumps (wells 1, 3, and 5), the pump outlet was disinfected with 70% ethanol before sampling, and the pump was manually operated for a few minutes to flush out stagnant water before direct collection into sterile bottles. Each well was sampled in triplicate per collection period. For open wells (wells 2 and 4), water was retrieved using a clean, contaminant- free pail attached to a rope, lowered to mid-depth to minimize sediment disturbance before transferring the sample into sterile wide-mouth bottles. Care was taken to prevent contact with the lid interior or external surfaces. All bottles were securely sealed, labeled, and transported in a cooler with ice packs. Samples were delivered to the College of Medical Laboratory Science Laboratory, Central Philippine University, within one hour for microbiological analysis and to the designated laboratory for physicochemical assessment.
Water physicochemical parameters
Except for the determination of water temperature (°C) which was done in situ, water samples were collected in sterile glass bottles and transported in a chilled container to ACA Water Analysis and Laboratory Services Inc., Iloilo City, within one hour for analysis. Water samples were examined for salinity (refractometer; ATAGO Co., Ltd., Tokyo, Japan), pH (HI 2210; Hanna instruments, Woonsocket, RI, USA), biochemical oxygen demand (BOD) (Azide Modification-Dilution Technique, SMEWW Method 5210B), dissolved oxygen (DO) (13), and total dissolved solid (TDS) (Gravimetric method, SMEWW 2540D) (13).
Bacteriological Analysis
Determination of Presumptive Aeromonas Count and Total Heterotrophic Plate Count
To assess Aeromonas spp. and other heterotrophic bacterial species, presumptive Aeromonas count (PAC) and heterotrophic plate count (HPC) were determined. For PAC, serial dilutions (10-1 to 10-5) of the water samples were prepared in sterile normal saline solution (NSS), and 100 µL of each dilution was plated in triplicate on Pseudomonas Aeromonas agar (Glutamate Starch Phenol Red [GSP] agar; Merck, Germany) supplemented with 10 mg/L penicillin. For HPC, 100 µL of each dilution was spread in triplicate onto tryptic soy agar (TSA; Merck, Germany) plates. Plates were incubated at 37°C for 24 hours before bacterial enumeration (14, 15).
Presumptive Aeromonas colonies were identified based on their characteristic yellow, 2–3 mm morphology with a surrounding yellow zone on GSP agar, following the manufacturer’s guidelines. Meanwhile, colony-forming units on TSA plates were used to estimate HPC. PAC and HPC results were expressed as colony-forming units per milliliter (CFU/mL) (14, 15).
Identification of Aeromonas spp. and other predominant bacterial taxa
Bacterial isolates from well water samples were identified during each sampling period. To determine the percentage composition of Aeromonas spp. and other predominant bacterial species, 24-hour-old colonies grown on GSP and TSA plates—previously used for PAC and HPC determinations—were categorized based on colony morphology, including shape, size, elevation, structure, color, and opacity. The number of colonies for each morphological type was recorded. Representative colonies (three to five per type) were streaked onto fresh TSA plates and subcultured to obtain pure isolates. These pure cultures were preserved in tryptic soy broth (TSB) with 15% glycerol and stored at -80 °C for further analysis.
Initial identification of selected bacterial isolates at the genus or species level was performed using standard biochemical techniques and taxonomic criteria described in Bergey’s Manual of Systematic Bacteriology (16), along with the commercial API 20E identification system (bioMérieux, France). For Gram-positive isolates, a comprehensive set of biochemical assays was employed, including catalase, coagulase, mannitol fermentation, arabinose fermentation, DNase activity, hemolysis on blood agar, nitrate reduction, thermonuclease (heat-stable DNase), oxidase, urease, lysostaphin sensitivity, and novobiocin susceptibility tests. Staphylococcus aureus ATCC 25923 was utilized as a reference strain for comparative purposes. The ability of the isolates to grow in 6.5% and 7.5% NaCl concentrations was also tested. On the other hand, identification of Gram-negative bacterial isolates was initially performed using the API 20E biochemical test system (bioMérieux, France). However, since some Gram-negative isolates exhibited identity scores of 85% or lower—suggesting low confidence in species-level identification—further confirmation was carried out through molecular characterization using 16S rRNA gene sequencing. Genomic DNA was extracted and purified using the DNeasy® Tissue Kit (QIAGEN, Hilden, Germany) and submitted to Macrogen Inc. (Seoul, South Korea) for sequencing with universal primers 27F and 1492R. The resulting sequences were compared against entries in the GenBank database using the BLAST algorithm provided by the National Center for Biotechnology Information (NCBI; http://blast.ncbi.nlm.nih.gov/).
Antibacterial susceptibility testing and determination of multiple antibiotic resistance (MAR) index
The bacteria isolated from the drinking well water were tested for antibiotic susceptibility using the Kirby-Bauer disc diffusion method on Mueller-Hinton agar plate (17). Ten commercially available antibiotic sensitivity discs (Mastdiscs™, Mast Group Ltd., UK) were utilized including Amoxicillin (25 µg), chloramphenicol (30 µg), doxycycline (30 µg), erythromycin (15 µg), enrofloxacin (5 µg), neomycin (30 µg), nitrofurantoin (300 µg), norfloxacin (10 µg), oxytetracycline (30 µg), and trimethoprim-sulphamethoxazole (25 µg) (11). The selection of antibiotics for susceptibility testing was based on their frequent and often indiscriminate use in human medicine, veterinary practice, and aquaculture (15), as reported by the Food and Agriculture Organization (FAO) (1). Twenty-four-hour cultures of the bacterial isolates grown on tryptic soy agar plates were suspended in 0.85% saline solution, and the suspension turbidity were adjusted to 0.5 McFarland. The inocula were plated on Mueller–Hinton agar. After 30 minutes, commercial antibiotic discs were applied to the plates with the use of a disc dispenser. The plates were incubated at 37°C for 18-24 hours (18). The antibiotic susceptibility of the tested strains was evaluated based on the guidelines of the Clinical and Laboratory Standards Institute (19).
The multiple antibiotic resistance (MAR) index was computed according to the method described by Krumperman (20). To determine the MAR index of a single isolate, the number of antibiotics to which the isolate is resistant were divided by the number of antibiotics to which the isolate was exposed. MAR index value higher than 0.2 is considered to have originated from high-risk sources of contamination such as humans, commercial poultry farms, swine, and dairy cattle wherein antibiotics were frequently used. MAR index value of ≤0.2 was regarded as bacterial strains whose origin comes from animals that are seldom or have not been exposed to antibiotics (20).
Statistical Analysis
The presumptive Aeromonas count (PAC) and heterotrophic plate count (HPC), expressed as CFU/mL, were log10- transformed and reported as mean ± standard deviation (SD). Analysis of variance (ANOVA) was performed to compare PAC and HPC across well water samples collected during the wet and dry seasons. Multiple comparisons were conducted using Tukey’s test, with statistical significance set at p < 0.05.
RESULTS
Physicochemical parameters
As shown in Table 2, the physicochemical parameters of well water exhibited significant seasonal variations (p < 0.05). The mean water temperature was significantly higher in the dry season, with well 5 recording the highest value (29.3 ± 0.6°C), while well 4 had the lowest (27.0 ± 0.0°C). In contrast, temperatures during the wet season were generally lower, ranging from 26.0 ± 0.0°C in wells 1 and 2 to 29.0 ± 0.0°C in well 5. pH levels also varied significantly between seasons (p < 0.05), with the highest values recorded in well 4 (7.8 ± 0.1) during the dry season and well 5 (7.7 ± 0.1) in the wet season, whereas well 1 exhibited the lowest pH in both seasons (6.8 ± 0.1 in dry; 6.9 ± 0.1 in wet) (Table 2).
Table 2.
Physicochemical characteristics of well water sources sampled from five selected urban barangays (villages) in Iloilo City. Values marked with different superscripts (a, b, c, d, e) within each column indicate statistically significant differences at p < 0.05
Biochemical oxygen demand (BOD) was significantly higher in the dry season (p < 0.05), peaking in well 3 (43.7 ± 0.6 mg/L), followed by wells 2 and 5 (41.7 ± 0.6 mg/L and 40.3 ± 0.6 mg/L, respectively). In contrast, BOD values were substantially lower in the wet season, with well 3 recording the highest concentration (15.7 ± 0.6 mg/L) and well 1 the lowest (7.8 ± 0.3 mg/L). Dissolved oxygen (DO) levels showed an opposite trend, with significantly higher values in the wet season (p < 0.05), particularly in well 4 (7.0 ± 0.0 mg/L), whereas the lowest DO concentrations were recorded in wells 3 and 4 (4.3 ± 0.6 mg/L) during the dry season (Table 2).
Total dissolved solids (TDS) exhibited the most pronounced seasonal variation (p < 0.05), with markedly higher concentrations in the dry season, especially in well 5 (9154.0 ± 3.5 mg/L), while the lowest TDS was observed in well 2 (850.7 ± 0.6 mg/L). In the wet season, TDS levels were significantly lower across all wells, ranging from 464.3 ± 0.6 mg/L in well 4 to 1205.0 ± 8.7 mg/L in well 1 (Table 2). These significant seasonal differences indicate the influence of environmental factors, such as rainfall and temperature fluctuations, on the physicochemical properties of well water.
Bacteriological Analysis
Presumptive Aeromonas count in the well water
Fig. 2A−E illustrates that PAC varied significantly across wells during the dry season (p < 0.05), with an overall increasing trend from week 1 to week 5, followed by fluctuations. Well 3 had the highest bacterial count, peaking at week 5 (3.67 Log10 CFU/mL, p < 0.05) (Fig. 2C), while wells 1 (Fig. 2A) and 2 (Fig. 2B) exhibited lower counts with significant increases at specific weeks. Well 4 showed moderate fluctuations, peaking at week 5 (2.89 Log10 CFU/mL) (Fig. 2D), while well 5 remained relatively stable, with a peak at week 9 (2.75 Log10 CFU/mL) (Fig. 2E). Overall, wells 3 (Fig. 2C) and 5 (Fig. 2E) exhibited higher bacterial proliferation, whereas wells 1 (Fig. 2A) and 2 (Fig. 2B) maintained lower bacterial loads.
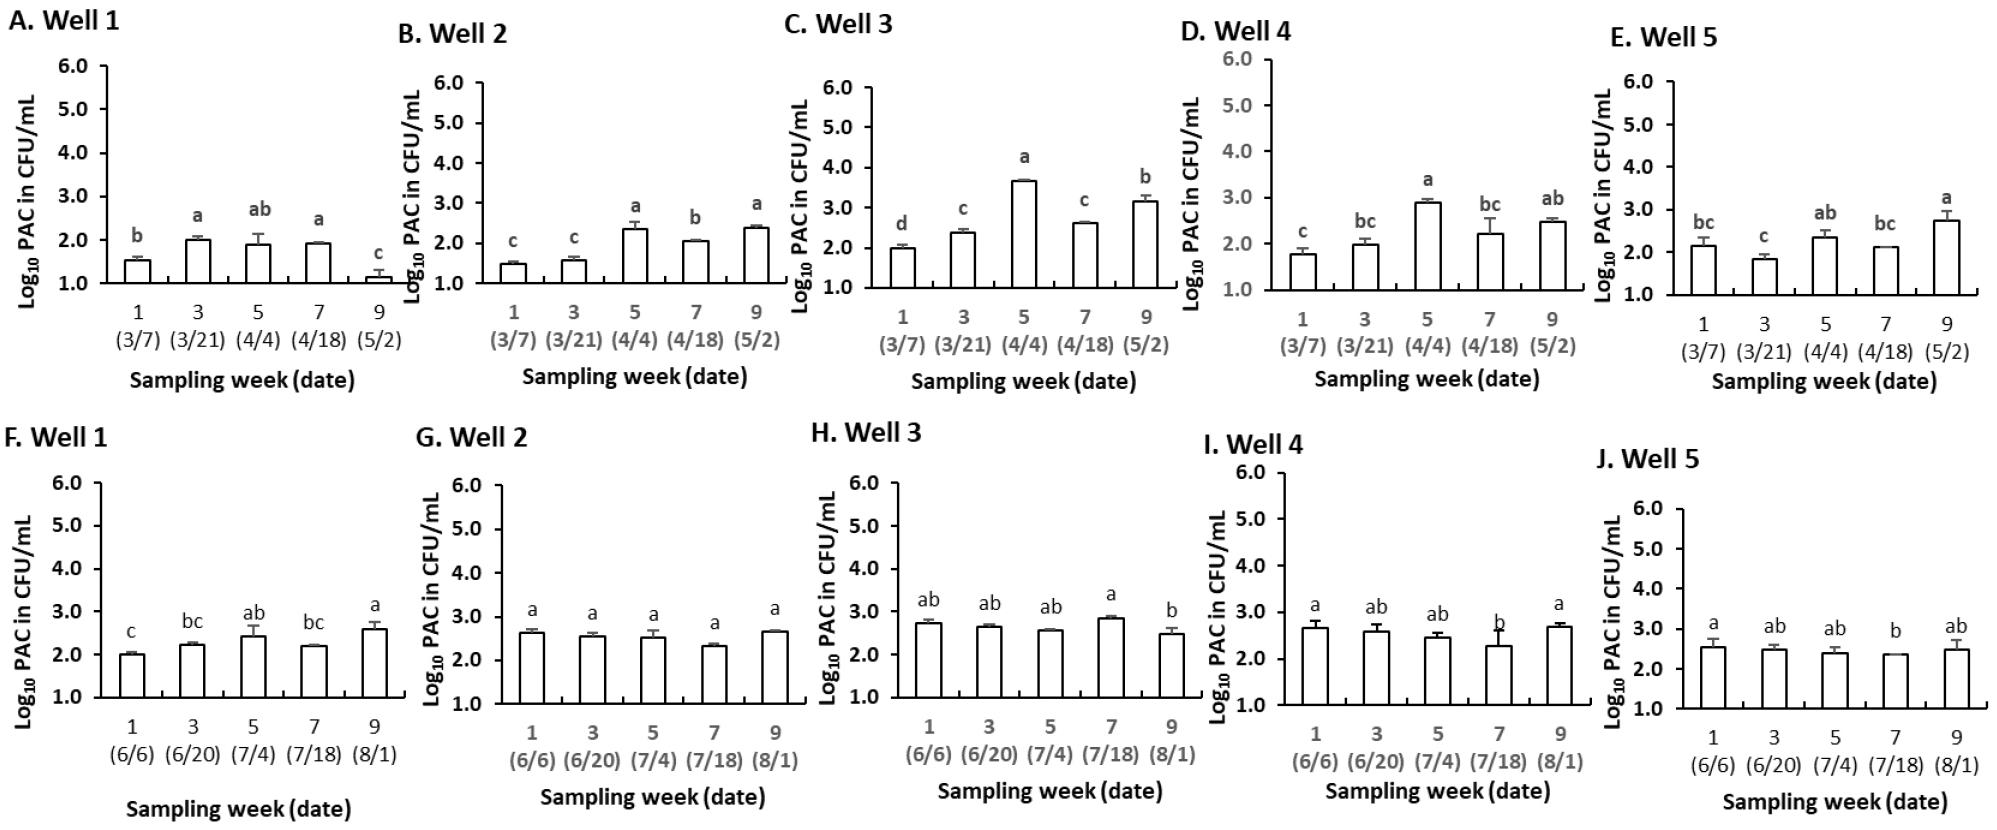
Fig. 2
Presumptive Aeromonas count (PAC) in water samples from 5 wells, quantified every 14 days over a 9-week period during the dry season (A−E) and wet season (F−J). Data represent the mean Log10 (±SD) CFU/mL of viable Aeromonas spp. at each sampling interval. Identical superscripts indicate no significant difference at p < 0.05.
Moreover, during the wet season, bacterial counts varied across wells over time, with significant differences in some cases (p < 0.05) (Fig. 2F−J). Well 1 showed a gradual increase, peaking at week 9 (2.60 Log10 CFU/mL) (Fig. 2F), while well 2 (Fig. 2G) remained stable, with no significant changes. Well 3 exhibited slight fluctuations, peaking at week 7 (2.85 Log10 CFU/mL) before declining in week 9 (p < 0.05) (Fig. 2H). Well 4 displayed a decreasing trend from week 1 to week 7 (p < 0.05), followed by a rebound in week 9 (Fig. 2I). Similarly, well 5 showed a minor decline before stabilizing (Fig. 2J). Overall, well 2 had the highest and most stable bacterial counts (Fig. 2G), while wells 1 (Fig. 2F) and 4 (Fig. 2I) experienced notable fluctuations. Wells 3 (Fig. 2H) and 5 (Fig. 2J) showed slight declines before stabilizing, suggesting variations in bacterial dynamics influenced by environmental conditions.
Heterotrophic plate count in the well water
As shown in Fig. 3A−E, during the dry season, HPC varied significantly across wells (p < 0.05). Well 1 (Fig. 3A) remained stable, while well 2 showed a significant decline until week 5, followed by a slight increase (Fig. 3B). Well 3 peaked sharply at week 5 (4.77 Log10 CFU/mL, p < 0.05) before declining (Fig. 3C). Well 4 maintained consistently high counts, with peaks at weeks 5 and 9 (p < 0.05) (Fig. 3D). Well 5 displayed the greatest variability, with a significant drop at week 3 (2.71 Log10 CFU/mL), followed by a substantial increase at week 5 (4.47 Log10 CFU/mL, p < 0.05) before stabilizing (Fig. 3E). Overall, well 4 exhibited the highest and most stable counts (Fig. 3D), while well 3 had the most pronounced peak (Fig. 3C). Wells 2 (Fig. 3B) and 5 (Fig. 3E) showed significant fluctuations, whereas well 1 (Fig. 3A) remained relatively stable.
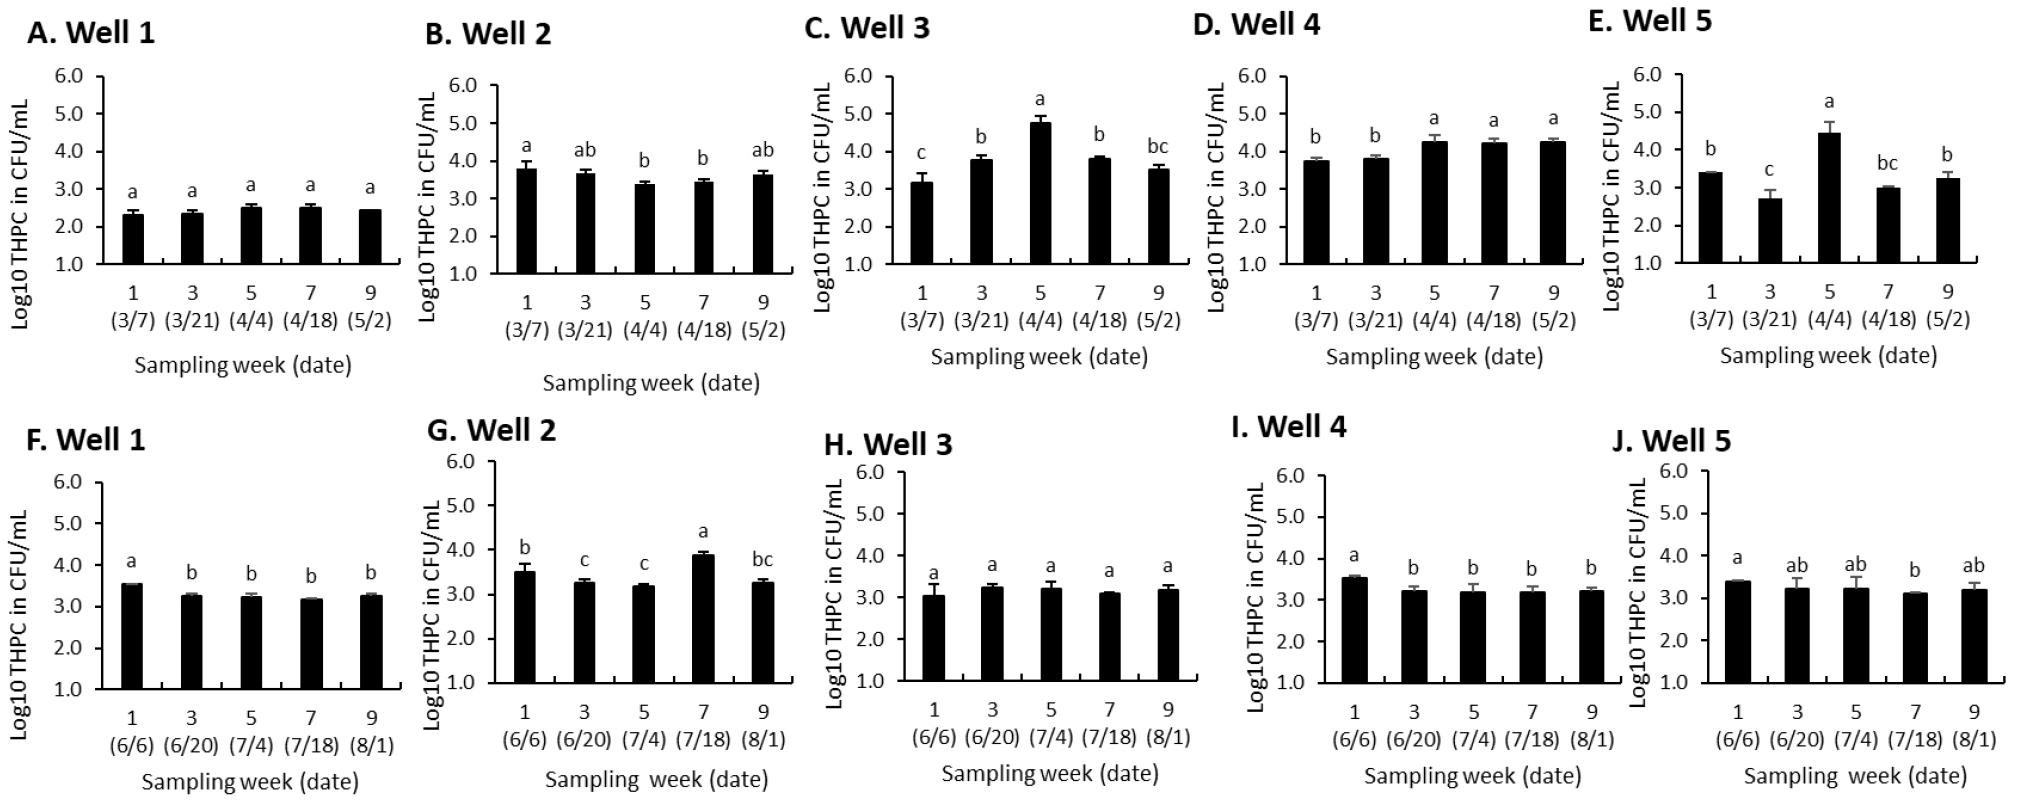
Fig. 3
Heterotrophic plate count (HPC) in water samples from five wells, quantified every 14 days over a 9-week period during the dry season (A−E) and wet season (F−J). Data represent the mean Log10 (±SD) CFU/mL of viable heterotrophic bacteria at each sampling interval. Identical superscripts indicate no significant difference at p < 0.05.
Additionally, HPC varied significantly across wells over time (p < 0.05) during the wet season (Fig. 3F−J). Well 1 exhibited a decreasing trend from week 1 (3.54 Log10 CFU/mL) to week 7 (3.16 Log10 CFU/mL), with significantly lower counts after week 1 (Fig. 3F). Well 2 showed a decline from week 1 (3.51 Log10 CFU/mL) to week 5 (3.18 Log10 CFU/mL), followed by a significant increase in week 7 (3.89 Log10 CFU/mL, p < 0.05), the highest among all wells (Fig. 3G). Well 3 remained stable throughout, with no significant variations (Fig. 3H). Well 4 also exhibited minimal fluctuations, though bacterial counts in weeks 3–9 were significantly lower than in week 1 (p < 0.05) (Fig. 3I). Well 5 showed slight variations, with a significant decrease at week 7 (3.10 Log10 CFU/mL, p < 0.05) before stabilizing (Fig. 3J). Overall, well 2 (Fig. 3G) exhibited the highest peak, while wells 3 (Fig. 3H) and 4 (Fig. 3I) showed the most stable bacterial counts.
Identification of Aeromonas spp. and other predominant bacterial taxa
Table 3 presents the taxonomic composition of Aeromonas spp. and other dominant bacterial taxa isolated from well water samples collected across five urban barangays (villages) in Iloilo City. A total of 119 bacterial isolates were recovered, with Aeromonas hydrophila emerging as the most prevalent species, accounting for 59% of all isolates. Its distribution was relatively consistent across seasons, comprising 61% and 57% of isolates during the wet and dry seasons, respectively. A. veronii was the second most frequently identified species, representing 21% of isolates, with a higher prevalence in the dry season (24%) compared to the wet season (18%). Escherichia coli and Enterococcus faecium were also detected, comprising 12% and 5% of the total isolates, respectively.
Table 3.
Taxonomic composition of Aeromonas spp. and other predominant bacterial taxa isolated from well water samples collected across five selected urban barangays (villages) in Iloilo City. “No.” denotes the total number of isolates analyzed
| Bacteria | Gram Reaction | Dry Season | Wet Season | Total | |||
|---|---|---|---|---|---|---|---|
| No. | % | No. | % | No. | % | ||
| Aeromonas hydrophila* | - | 36 | 57 | 34 | 61 | 70 | 59 |
| Aeromonas veronii** | - | 15 | 24 | 10 | 18 | 25 | 21 |
| Escherichia coli*** | - | 8 | 13 | 6 | 11 | 14 | 12 |
| Enterococcus faecium**** | + | 4 | 6 | 2 | 4 | 6 | 5 |
| Staphylococcus aureus | + | 0 | 0 | 4 | 7 | 4 | 3 |
| Total | 63 | 100 | 56 | 100 | 119 | 100 | |
To confirm the taxonomic identities of selected Gram-positive (E.faecium) and Gram-negative (A. hydrophila, A. veronii, and E. coli) isolates, representative strains initially identified through conventional biochemical tests—including arabinose fermentation, growth in 6.5% NaCl, and the API 20E system—were further analyzed via 16S rRNA gene sequencing. The resulting sequences exhibited high similarity (94.8%–99.8%) to reference strains of E. faecium, A. hydrophila, A. veronii, and E. coli, as documented in the NCBI database (Table 4). All validated sequences have been deposited in the European Nucleotide Archive (ENA) under Project Accession Number PRJEB89848.
Table 4.
Identification of selected bacterial isolates from well water samples through 16S rRNA gene sequence analysis and comparison with closely related strains in the NCBI database
Notably, S. aureus was detected exclusively during the wet season, accounting for 7% of all isolates. These Gram-positive bacteria displayed consistent phenotypic characteristics, including positive results for catalase and coagulase activity, mannitol fermentation, DNase and thermonuclease (heat-stable DNase) activity, nitrate reduction, and urease production. The isolates also demonstrated growth in 7.5% NaCl, exhibited β-hemolysis on blood agar, and were susceptible to lysostaphin and novobiocin, collectively confirming their identification as S. aureus.
Antimicrobial susceptibility of Aeromonas spp. and other predominant bacterial spp.
Table 5 presents the antibiotic resistance profiles of Aeromonas spp. and other predominant bacterial taxa recovered from well water samples in selected urban barangays of Iloilo City. The isolates were tested against ten antibiotics commonly used in human medicine, veterinary care, and aquaculture. A. hydrophila exhibited high resistance to amoxicillin (98.6%), erythromycin (100%), and neomycin (97.1%), with moderate resistance to oxytetracycline (51.4%). A. veronii also showed high resistance to amoxicillin (96%) and moderate resistance to erythromycin (60%). E. faecium was completely resistant to amoxicillin and erythromycin, with substantial resistance to oxytetracycline and trimethoprim-sulfamethoxazole (66.7%). E. coli displayed multidrug resistance, particularly to amoxicillin and erythromycin (100%), along with notable resistance to nitrofurantoin (64.3%) and trimethoprim-sulfamethoxazole (50%). S. aureus was resistant to all tested antibiotics except fluoroquinolones, showing complete resistance to amoxicillin, erythromycin, neomycin, and nitrofurantoin (100%).
Table 5.
Antibiotic resistance profiles of of Aeromonas spp. and other predominant bacterial taxa recovered from well water samples collected from selected urban barangays (villages) in Iloilo City. The isolates were tested against ten antibiotics commonly employed in human medicine, veterinary care, and aquaculture practices
| pBacteria | Number of isolates examined | Percent (%) Resistant Strains | |||||||||
|---|---|---|---|---|---|---|---|---|---|---|---|
| B-lactam | Phenicol | Macrolide |
Amino- glycoside | Nitrofurans | Fluoroquinolones | Tetracyclines |
Sulfo- namides | ||||
| AMX* | CHL* | ERY* | NEO* | NIT* | NOR* | ENR* | OTC* | DOX* | SXT* | ||
| Aeromonas hydrophila | 70 | 98.6 | 7.1 | 100 | 97.1 | 2.9 | 1.4 | 4.3 | 51.4 | 0 | 8.6 |
| Aeromonas veronii | 25 | 96 | 0 | 60 | 92 | 0 | 4 | 4 | 4 | 0 | 0 |
| Enterococcus faecium | 6 | 100 | 0 | 100 | 50 | 0 | 0 | 0 | 66.7 | 0 | 66.7 |
| Escherichia coli | 14 | 100 | 42.9 | 100 | 57.1 | 64.3 | 42.9 | 0 | 57.1 | 0 | 50 |
| Staphylococcus aureus | 4 | 100 | 0 | 100 | 100 | 100 | 0 | 0 | 0 | 0 | 0 |
MAR index of Aeromonas spp. and other predominant bacterial spp.
Results of the antimicrobial susceptibility testing demonstrated that all of the A. hydrophila (n=70) and A. veronii (n=25) isolates tested were resistant to antibiotics belonging to 3 or more categories (Table 6) and therefore considered as multiple drug-resistant strains. Similarly, 100% of the E. faecium (6), E. coli (14), and S. aureus (4) isolates tested were resistant to antibiotics belonging to 3 or more categories. As shown in Table 5, A. hydrophila exhibited MAR indices primarily between 0.3 (47.1%) and 0.4 (44.3%), with a few isolates showing higher resistance (0.6–0.7). Similarly, A. veronii displayed a broad MAR index distribution, with 40% of isolates at 0.2 and 36% at 0.4. E. faecium had a predominant MAR index of 0.4 (50%), while E. coli showed the highest resistance, with most isolates (64.3%) at 0.5 and 14.3% at 0.6. Notably, all S. aureus isolates exhibited a MAR index of 0.4, suggesting a uniform resistance pattern.
Table 6.
Multiple antibiotic resistance (MAR) index of Aeromonas spp. and other predominant bacterial taxa isolated from well water samples collected across five selected urban barangays (villages) in Iloilo City.
DISCUSSION
The widespread occurrence of virulent and antibiotic-resistant Aeromonas spp. in drinking water sources, particularly community wells, poses a significant public health risk, especially among immunocompromised individuals and low-income populations (6, 10, 21). Despite these concerns, there is still a lack of research on Aeromonas spp. contamination in Philippine well water sources. To bridge this gap, this study is the first to examine presumptive Aeromonas counts (PAC) and the dominant Aeromonas species composition in five community wells across five barangays in Iloilo City, Philippines, during both dry and wet seasons. Accordingly, notable seasonal fluctuations in Aeromonas load (Fig. 2) and heterotrophic bacteria (Fig. 3) were noted, likely driven by variations in water quality parameters. These findings underscore the need for continuous microbial and physicochemical monitoring of groundwater sources to evaluate water quality and guide public health interventions.
During the dry season, PAC levels exhibited notable fluctuations across all wells, with pronounced peaks in specific weeks, particularly in Wells 1, 2, and 3 (Fig. 2A−C). Well 3 recorded the highest bacterial count, with a significant increase in week 5 (Fig. 2C), while Well 2 showed a gradual rise, peaking in weeks 5 and 9 (Fig. 2B). Well 1 displayed variability, peaking in weeks 3 and 7 before declining in week 9 (Fig. 2A). These fluctuations may be attributed to environmental conditions favoring bacterial growth, such as elevated temperatures (27.0–29.3°C), increased biological oxygen demand (BOD) (24.7–43.7 mg/L), and lower dissolved oxygen (DO) levels (4.3–6.0 mg/L) (Table 2). High BOD values indicate increased organic matter, which serves as a nutrient source for bacterial proliferation (22), while reduced DO levels, particularly in Wells 3 and 4, create a favorable microaerophilic environment for Aeromonas spp. (23). Conversely, during the wet season, PAC levels remained relatively stable across all wells, with fewer fluctuations compared to the dry season (Fig. 2F−J). Well 2 exhibited consistent bacterial counts (Fig. 2G), while Wells 3, 4, and 5 (Fig. 2H−J) demonstrated minor variations. This decline in bacterial counts is likely due to lower water temperatures (26.0–26.3°C), reduced BOD levels (7.8–15.7 mg/L), and increased DO concentrations (6.2–7.0 mg/L) (Table 2). The dilution effect of rainfall may have contributed to a reduction in organic matter concentration, thereby limiting bacterial proliferation (24, 25). Additionally, a decline in total dissolved solids (TDS) during the wet season, particularly in Wells 3 and 4 (Fig. 2H and I), suggests increased water volume and flow, further reducing bacterial concentrations (25). Despite these seasonal changes, Aeromonas spp. persisted in all wells, indicating their ability to withstand environmental fluctuations and remain viable in groundwater sources (4).
Water quality parameters play a crucial role in Aeromonas spp. survival and proliferation. In this study, BOD and TDS levels appeared to be key factors influencing bacterial counts. Wells with higher BOD values, such as Well 3 in the dry season, exhibited increased PAC levels, supporting the hypothesis that organic matter availability promotes Aeromonas growth (22). Likewise, elevated TDS concentrations, particularly in Well 5 during the dry season (9154 mg/L), indicate increased organic and inorganic solutes, potentially providing favorable conditions for bacterial persistence. These findings are consistent with those reported in previous studies indicating that Aeromonas spp. persist in nutrient-rich aquatic environments (15).
Seasonal variation in pH levels also warrants consideration. While all wells remained within the neutral to slightly alkaline range, minor fluctuations were observed (e.g., Well 1, pH 6.8–6.9; Well 4, pH 7.3–7.8). Studies indicate that Aeromonas spp. prefer slightly alkaline conditions (pH 7.0–8.0) for optimal growth (3, 5). Although pH stability suggests that acidity or alkalinity is not the primary driver of seasonal bacterial fluctuations, it may still contribute to the persistence of Aeromonas in groundwater sources.
The persistence of Aeromonas spp. in well water raises significant public health concerns, particularly in communities dependent on untreated groundwater. These bacteria have been linked to gastrointestinal infections, wound infections, and emerging antimicrobial resistance (3, 5, 10). The presence of Aeromonas spp. throughout both seasons, despite fluctuations in water quality parameters, underscores their resilience and potential for waterborne transmission. Despite clear seasonal trends in PAC levels, the absence of baseline studies on Aeromonas contamination in Philippine groundwater sources remains a significant limitation. In contrast to developed countries such as the Netherlands, where comprehensive data on Aeromonas ecology and public health risks are available (26), similar studies in the Philippines are lacking. This lack of surveillance hinders a deeper understanding of contamination pathways, seasonal influences, and associated health risks, emphasizing the urgent need for long-term monitoring.
As shown in Table 3, A. hydrophila was the predominant species isolated from well water samples, accounting for 59% of the total isolates, with a slightly higher prevalence during the wet season (61%) compared to the dry season (57%). A. veronii was the second most frequently detected species, comprising 21% of the total isolates, with an increased occurrence in the dry season (24%) relative to the wet season (18%). The dominance of A. hydrophila is of particular concern due to its well-characterized pathogenic potential, including the production of hemolysins, enterotoxins, and biofilm formation. Its consistent presence across both seasons suggests its environmental adaptability, likely influenced by favorable physicochemical conditions such as elevated organic matter and moderate temperature. A. veronii, though less frequently isolated, is also a known opportunistic pathogen capable of causing diarrhea and extraintestinal infections, with its seasonal variation potentially influenced by shifts in water quality parameters (3, 4, 5, 10). The detection of these Aeromonas species in community wells raises significant public health concerns, particularly for populations relying on untreated groundwater. Given their documented association with human infections and emerging antimicrobial resistance, routine microbial surveillance and water quality assessments are imperative to mitigate potential health risks and ensure the safety of drinking water sources.
The results presented in Table 5 show that A. hydrophila and A. veronii exhibited high levels of antibiotic resistance, particularly to β-lactams and macrolides. Nearly all A. hydrophila (98.6%) and A. veronii (96%) isolates were resistant to β-lactam antibiotics such as amoxicillin. This concurs with previous studies that reported 100% resistance to ampicillin, another β-lactam antibiotic, in Aeromonas spp. from aquatic environments (27). Similarly, erythromycin resistance was observed in all A. hydrophila isolates (100%) and a majority of A. veronii isolates (60%), further supporting previous findings that Aeromonas spp. commonly exhibit resistance to macrolides (28). Resistance to aminoglycosides was also pronounced, with 97.1% of A. hydrophila and 92% of A. veronii isolates resistant to neomycin, suggesting exposure to antimicrobial residues from human, veterinary, or aquaculture sources (11). These aminoglycoside resistance rates exceed those reported in some aquatic environments, indicating potential regional variations in antibiotic pressure (27). In contrast, resistance to fluoroquinolones and tetracyclines was lower, with only 4.3% of A. hydrophila isolates resistant to enrofloxacin and 51.4% to oxytetracycline, while resistance to doxycycline and sulfonamides was nearly absent. This variation suggests antibiotic-specific selective pressures shaping resistance patterns in well water sources (21, 27, 28).
The data presented in Table 6 further support these findings by demonstrating the multiple antibiotic resistance (MAR) index distribution among Aeromonas isolates. Notably, 47.1% of A. hydrophila isolates exhibited a MAR index of 0.3, while 44.3% had a MAR index of 0.4, suggesting significant exposure to multiple antibiotics and potential health risks if these bacteria harbor transferable resistance genes. Similarly, A. veronii showed a broader MAR index distribution, with 40% of isolates at 0.2 and 36% at 0.4, indicating variability in resistance acquisition and selective pressures. These findings align with previous studies where Aeromonas isolates from aquatic environments exhibited MAR indices ranging from 0.25 to 0.68, reinforcing the role of contaminated water sources in the persistence and spread of multidrug-resistant strains (11, 27). The presence of MAR indices ≥0.2 is particularly concerning, as it signifies exposure to environments with substantial antibiotic contamination. This underscores the need for continuous monitoring and improved wastewater and groundwater management to mitigate the risks of antimicrobial resistance in well water sources.
In addition to Aeromonas spp., we investigated the prevalence of heterotrophic bacteria in the well water samples, which is a crucial indicator of the level of microbial contamination. The HPC reflects the presence of a diverse range of heterotrophic bacteria, including opportunistic pathogens, and provides insight into the effectiveness of natural filtration, aquifer conditions, and possible sources of organic pollution. Monitoring HPC is essential for assessing water safety, as elevated counts may indicate deteriorating water quality, increased nutrient loads, or potential public health risks associated with microbial contamination (29, 30). As shown in Fig. 3A−E, HPC during the dry season exhibited significant fluctuations across wells (p < 0.05), highlighting variability in microbial stability. Well 4 (Fig. 3D) maintained the highest and most stable counts, while well 3 (Fig. 3C) peaked sharply at week 5 before declining. Similarly, well 5 (Fig. 3E) showed considerable variability, with a sharp decline at week 3 followed by a substantial increase. These fluctuations align with studies indicating that microbial loads in groundwater are influenced by environmental conditions such as temperature, nutrient availability, and potential contamination sources (31). The significant decline in well 2 (Fig. 3B) followed by a later increase suggests possible shifts in aquifer dynamics, as previously observed in groundwater monitoring studies (32). Moreover, as shown in Fig. 3F−J, bacterial counts during the wet season also varied significantly (p < 0.05), with well 2 (Fig. 3G) exhibiting the highest peak at week 7, while wells 3 (Fig. 3H) and 4 (Fig. 3I) maintained stable counts. The overall decrease in HPC in some wells compared to the dry season may be attributed to increased water flow, dilution effects, and changes in physicochemical parameters such as pH and turbidity, which have been shown to influence bacterial survival in groundwater (33). The stability observed in wells 3 (Fig. 3H) and 4 (Fig. 3I) suggests consistent environmental conditions, possibly linked to aquifer characteristics and reduced external contamination, as previously reported in similar studies on groundwater quality and microbial persistence (34). These findings underscore the necessity of continuous monitoring to assess seasonal dynamics and potential public health risks associated with microbial contamination in well water sources.
The antibiotic resistance profiles of other predominant bacterial taxa isolated from well water samples in Iloilo City likewise reveal significant multidrug resistance patterns. E. faecium exhibited complete resistance to amoxicillin and erythromycin, with substantial resistance to oxytetracycline and trimethoprim-sulfamethoxazole (66.7%). Similarly, E. coli showed 100% resistance to amoxicillin and erythromycin, along with notable resistance to nitrofurantoin (64.3%) and trimethoprim- sulfamethoxazole (50%). S.aureus was resistant to all tested antibiotics except fluoroquinolones, demonstrating complete resistance to amoxicillin, erythromycin, neomycin, and nitrofurantoin. These findings align with global trends indicating increasing antimicrobial resistance among these species. For instance, studies have reported elevated levels of antibiotic resistance in E. coli and Enterococcus spp. isolates from various environments (35). Additionally, S. aureus has been documented to develop resistance to multiple antibiotic classes, posing significant treatment challenges (36). The multiple antibiotic resistance (MAR) index analysis further underscores the extent of resistance. E. faecium predominantly exhibited a MAR index of 0.4 (50%), while E. coli showed higher resistance levels, with 64.3% of isolates at a MAR index of 0.5 and 14.3% at 0.6. Notably, all S. aureus isolates had a MAR index of 0.4, indicating uniform resistance patterns. MAR indices above 0.2 are concerning, as they suggest significant exposure to antibiotics and potential public health risks associated with antibiotic-resistant bacteria in well water sources. These observations are consistent with reports highlighting the prevalence of multidrug-resistant E. faecium and E. coli strains in various environments (35), as well as the capacity of S. aureus to acquire resistance to multiple antibiotic classes (36).
In conclusion, this study highlights the widespread presence of virulent and antibiotic-resistant Aeromonas spp. in well water across Iloilo City, posing significant public health risks, especially to vulnerable populations. Seasonal variations influenced bacterial abundance, with higher counts observed during the dry season, likely due to increased organic matter and reduced dissolved oxygen levels. A. hydrophila was the predominant species, demonstrating high resistance to β-lactams, macrolides, and aminoglycosides. Other bacterial taxa, including E. coli, E. faecium, and S. aureus, also exhibited multidrug resistance, with Multiple Antibiotic Resistance (MAR) indices exceeding the critical threshold of 0.2, indicating sustained antibiotic exposure. While the MAR index provided valuable insight into potential contamination sources, this study did not assess the specific pathways by which antibiotics entered the well water, such as runoff from agricultural activities, domestic wastewater discharge, or aquaculture effluents. This limitation underscores the need for future research to identify and characterize these contamination routes to better inform risk assessment and targeted mitigation strategies.
To address these concerns, regular microbial and physicochemical monitoring should be implemented to track seasonal variations and pinpoint contamination sources. Disinfection methods, including chlorination and filtration, are recommended for community wells to reduce bacterial contamination and enhance water quality. Enhanced public health surveillance is essential to detect and respond to waterborne infections linked to Aeromonas spp. and other resistant bacteria promptly. Furthermore, strengthening antibiotic stewardship programs across human healthcare, agriculture, and aquaculture sectors is critical to curtail the spread of antimicrobial resistance in environmental water sources. Lastly, community education and public health campaigns should be intensified to promote safe water usage practices, thereby reducing the health risks associated with consumption of untreated groundwater.
