

INTRODUCTION
Mesenchymal stem cells (MSCs) are mesoderm-derived adult stem cells possessing multidirectional differentiation potential. MSCs are located around perivascular spaces of various tissues expressing CD146, including dental pulp, bone marrow (BM), adipose tissue, neonatal placenta, amniotic membrane, and umbilical cord (1). We previously isolated MSCs from human tonsils (T-MSCs) (2) and showed their differentiation potential and immune modulatory effects (3). MSCs can migrate to injured tissue and secrete various paracrine factors, inducing regeneration in the damaged tissue. MSCs contribute to tissue repair largely through paracrine factors and stimulation of target cells, but not by cell replacement (4). Specifically, MSCs mediate fibrosis, angiogenesis, immune modulation, chemotaxis, apoptosis, and proliferation (5).
Co-transplantation of MSCs and BM cells enhanced the engraftment of donor cells after BM transplantation (BMT) in a murine model possibly via increased expression of hematopoietic factors and inhibited apoptosis, allowing hematopoietic stem cells (HSCs) to survive and proliferate in the stroma (6, 7). Moreover, enhancing self-renewal and proliferation of HSCs depends on the survival and homing of HSCs into the BM. MSCs improve homing and hematopoietic reconstitution, causing chimerism (8); however, the mode of action or interaction is unclear. Another effect of MSCs in allogeneic BMT is the prevention of graft-versus-host disease, possibly by inducing regulatory or immunomodulatory effects of T cells (6).
We previously showed that co-transplantation of T-MSCs with BM cells accelerated the recovery of the involuted thymus after conditioning of the allogeneic BMT model with busulfan-cyclophosphamide, possibly by inducing FMS‑like tyrosine kinase 3 ligand (FLT3L) and fibroblast growth factor 7 (FGF7) production (9). Because T-MSCs caused recovery of the thymus and T cell repertoire after co-transplantation of BM and MSCs, we questioned the effect of MSCs on circulating T cells via secondary lymphoid organs, e.g., the spleen. In this study, we analyzed the effect of externally administered T-MSCs on immune response by modulating the movement of T lymphocytes using the mouse allogeneic BMT model.
MATERIALS AND METHODS
Animal experiment
The Institutional Animal Care and Use Committees (IACUCs) of Ewha Womans University approved the animal experiments (approval no. EUM20-015 and EWHA MEDIACUC21-031-t). Female BALB/c mice (H-2d, 6 weeks old) and male C57BL/6 mice (H-2b, 5 weeks old) were purchased from Orient Bio (Seoul, Korea). All mice were housed at 21–23℃ with 51%–54% humidity in a pathogen-free environment with a 12-h light/dark cycle and provided food and water ad libitum.
Cell culture
Tonsil Mesenchymal Stem Cells (T-MSCs, IRB number EUMC 2018-01-011-002) were obtained and maintained as in a previous study (2). T-MSCs were cultured in low-glucose Dulbecco’s modified Eagle medium (DMEM, Welgene, Daegu, Korea) supplemented with 10% heat inactivated fetal bovine serum (FBS, Welgene) and 100 units/ml penicillin and 100 μg/ml streptomycin in T-75 cell culture flasks. The cells were washed once with phosphate-buffered saline (PBS) to eliminate FBS and then incubated with 0.25% trypsin-ethylenediaminetetraacetic acid (EDTA; Welgene) at 37℃ for subculture. After 10 min, the cells were collected in the conical tube and centrifuged at 190 g for 5 min. The pellet was resuspended by low-glucose DMEM, seeded in T-75 cell culture flasks, and cultured in a humid atmosphere with a 5% CO2 incubator at 37℃. When the cells were reached to 80% confluence, cells were harvested with trypsin treatment, followed by three washing with PBS. MSCs were resuspended with low-glucose DMEM at a final volume of 200 μl before injecting bone marrow cells into the mice’s tail vein.
Allogeneic bone marrow transplantation
Female BALB/c recipient mice were treated with busulfan (Bu; 20 mg/kg/day) for 4 days and cyclophosphamide (Cy; 100 mg/kg/day) for 2 days via an intraperitoneal injection to empty the mice’s bone marrow. BMT was performed after a day of rest. Male C57BL/6 donor mice were sacrificed by cervical dislocation to isolate bone marrow cells (BMCs). The BMCs were extracted from the femoral and tibial medullary cavities and prepared as a single-cell suspension. The cells were filtered using a 70-μm cell strainer (SPL Life Sciences, Pocheon-si, Korea) and centrifuged at 190 g for 5 min at room temperature. The pellet was resuspended with ACK lysis buffer (150 mM NH4Cl, 10 mM KHCO3, 0.1 mM Na2EDTA, pH 7.3) to remove red blood cells. The mixture was centrifuged at 190 g for 5 min, and the supernatant was eliminated. The pellet was resuspended in 100 μl of serum-free low-glucose DMEM. Then, the mice received an injection of 1×10⁷ BMCs (Bu-Cy + BMT, the “BMT” group) or 1×10⁷ BMCs combined with 2×10⁶ T-MSCs (Bu-Cy + BMT + T-MSC, the “T-MSC” group) in a total volume of 200 μl in the lateral tail vein. For 40 days, the recipient mice were monitored daily, documenting their survival rate and weight changes. The humane endpoint was described during the experimental periods as the moment when the animal lost 20% of its starting weight, at which point the animal was sacrificed immediately. Mice were sacrificed by cervical dislocation on day 40 after allogeneic BMT. Male C57BL/6 mice received an injection of 2×10⁶ T-MSCs to evaluate the effect of T-MSC treatment on lymphocyte migration. Then, the mice were sacrificed after 7 days for blood and spleen analysis.
T cell receptor-beta sequencing
For the analysis of receptor diversity of the T cells from BMT mice, thymus and spleen of the BMT mice were collected at day 3, 10 and 40 after BMT. The RNA was extracted with the RNeasy Plus Mini Kit (Qiagen, Hilden, Germany). The RNA samples were analyzed for purity and concentration followed by sending to Macrogen (Seoul, Korea) for the sequencing. The primers were designed to cover V-D-J-C genes averaging 380 bp. The TCR beta V-D-J-C genes sequences were analyzed using the iRepertoire panel (https://www.irepertoire.com). The D50 value is the percent of dominant and unique T cell clones that cumulatively account for 50% of the total complementarity determining region 3 (CDR3) sequences in each sample. Therefore, if the D50 value is closer the value to 50, it is the more diverse the TCR repertoire. The D50 was calculated as follows: D50 = (number of unique CDR3s composing 50% of the reads of the top 10,000 unique CDR3s × 100)/10,000. An illustrative tree map was used to show V-J-unique CDR3s. Each unique CDR3 within a given V-J-combination was subsequently represented by a rounded rectangle. The unevenness of squares reflects areas of thymus-dependent clonal expansion of the thymocyte repertoire and repopulate and circulate clones of the spleen, respectively. The frequencies of V and J genes were analyzed using the clustering method (https://www.R-project.org/) for the comparison of TCR-beta V and J genes from the thymus and spleen.
Flow cytometry
The isolated blood and spleen cells were washed with buffer for flow cytometry (0.1% NaN3, 0.5% FBS in PBS), treated with purified rat anti-mouse CD16/CD32 (BD Pharmingen, San Diego, CA), and stained with anti-CD3 (17A2, Rat IgG2b, κ), anti-CD4 (GK1.5, Rat IgG2b, κ), anti-CD8a (53-6.7, Rat IgG2a, κ), anti-H-2Kb (AF6-88.5, BALB/c IgG2a, κ), anti-CD69 (H1.2F3, Armenian Hamster IgG), anti-VLA-4 (CD49d, R1-2, Rat IgG2b, κ), and anti-CD62L (W18021D, Rat IgG2a, κ) antibodies (BioLegend, San Diago, CA) to analyze cell phenotypes. Afterward, the cells were fixed in 4% paraformaldehyde (Sigma-Aldrich, St. Louis, MO). The stained cells were acquired and analyzed using a Novocyte flow cytometer (ACEA Biosciences, Santa Clara, CA).
Immunohistochemistry
Spleen tissue samples were embedded in paraffin. For immunohistochemistry (IHC) studies, tissue sections were deparaffinized by immersing in xylene (JUNSEI Chemical, Tokyo, Japan) twice for 5 min and then hydrated. The samples were soaked in 100%, 95%, 90%, 80%, and 70% ethanol each for 3 min. Then, the samples were soaked in distilled water for 10 min and washed with PBS for 5 min. Endogenous peroxide was blocked in a humid chamber for 10 min using hydrogen peroxide (Enzo Life Sciences, NY). Afterward, the samples were washed with PBS for 5 min again. The samples were then incubated with primary anti-CD69 rabbit polyclonal antibody (Abcam, Cambridge, UK) diluted in PBS at 1:100 30 min at 4℃. The samples were washed with PBS for 5 min. After washing with PBS for 5 min, the specimens on the slides were incubated with Polyview IHC reagent (Enzo Life Sciences) for 20 min. Then, the samples were washed with PBS for 5 min and incubated with Highdef substrate solution (alkaline phosphatase, AP) for 15 min. After a repeated PBS wash, the samples were counterstained with hematoxylin for 30 sec. Afterward, the samples were washed in running water for 5 min, followed by dipping 3 times in 1% acid alcohol and again washing in running water for 5 min. The samples were then dehydrated by dipping in 70%, 80%, 90%, 95%, and 100% ethanol for 3 min each. The slides were soaked in xylene for 5 min and mounted using a mounting compound (Thermo Fischer Scientific, Waltham, MA). IHC analysis was performed using a slide scanner (Aperio Scanscope FL, Leica Biosystems, Seattle, WA).
Real-time PCR array
Male C57BL/6 mice were sacrificed, and their spleens were isolated for T cell separation by MACS Pan T cell isolation kit II (Milteny Biotec, Bergisch Gladbach, Germany). Then, T cells (1×10⁷ cells, upper wells) were co-cultured with or without T-MSCs (1×10⁶ cells, lower wells) in a transwell (pore size 0.4 μm, Corning, Somerville, MA) for 24 h with IL-2. After RNA isolation, quantitative polymerase chain reaction (qPCR) arrays (QIAGEN RT² Profiler PCR array mouse chemokines and receptors, Hilden, Germany) were performed. Data were analyzed with RT²Profiler PCR Data Analysis using glyceraldehyde-3-phosphate dehydrogenase (GAPDH) gene as control.
RESULTS
T-MSC transfer in bone marrow transplantation after Bu-Cy conditioning enhanced the recovery from weight loss and the survival rate
Mice received an injection of Bu-Cy for cytotoxic conditioning and/or transplanted BMCs and BMCs with T-MSCs in the tail vein and were observed for 40 days after cell transfer to identify the effect of T-MSCs on body weight recovery and survival rate following allogeneic BMT (Fig. 1A). Rapid weight loss was observed within 7 days in mice after the Bu-Cy injection but not in control (no treatment) mice (Fig. 1B). Mice co-transplanted with T-MSCs regained their body weight more quickly than the Bu-Cy-only group or Bu-Cy + BMT mice. Although body weight recovery of Bu-Cy + BMT mice was lower than that of Bu-Cy mice until 30 days after the cell transfer, their body weight and survival rate were much higher on day 40 (Fig. 1B). Due to severe pre-conditioning, the Bu-Cy group exhibited high fatality rate during the experimental period without BM cells. In contrast, Bu-Cy + BMT and Bu-Cy + BMT + T-MSC groups showed extended survival times showing 60% and 100% survival rates, respectively, during the experimental period (Fig. 1C).
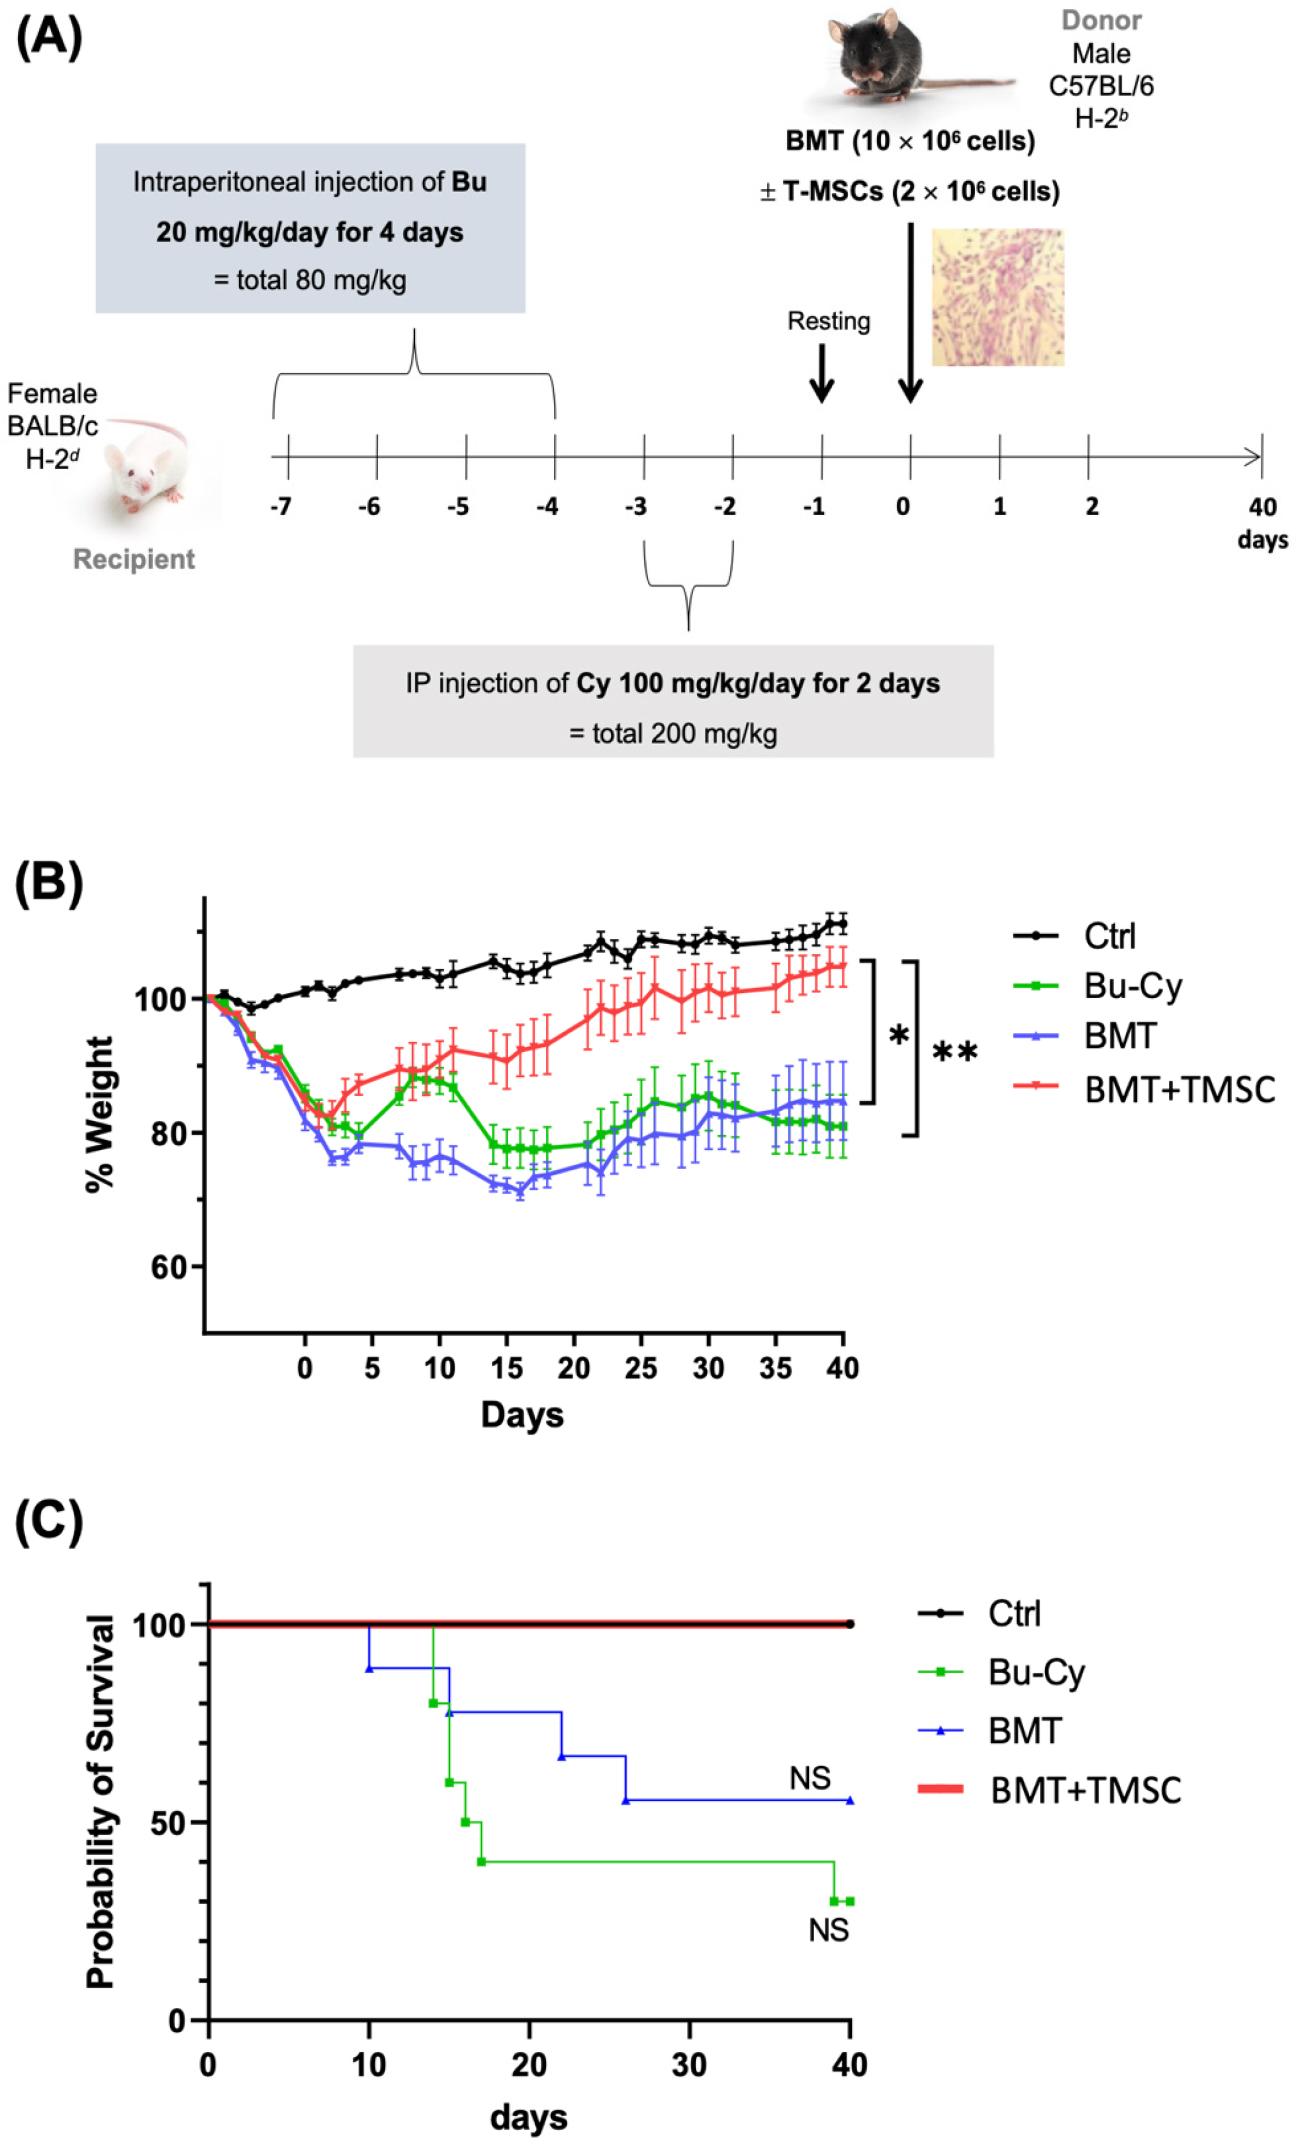
Fig. 1
Weight change and survival course in BMT mice. (A) Experimental scheme for BMT and T-MSC transfer dose and time schedule. (B) BALB/c female mice received an injection of busulfan (Bu; 20 mg/kg/day) for 4 days, followed by cyclophosphamide (Cy; 100 mg/kg/day) for 2 days. The mice were grouped into 4 experimental groups: normal female BALB/c (normal control), Bu and Cy treatment only (Bu-Cy), transplantation of BMCs from C57BL/6 mice after Bu-Cy treatment (Bu-Cy + BMT), and transplantation of BMCs plus T-MSCs after Bu-Cy treatment (Bu-Cy + BMT + T-MSC). The graph presents body weight changes in experimental mice (n = 10 for each group) for 40 days after BMT. *P < 0.05 after D40 post-BMT, **P < 0.01 after D40 post-BMT. (C) The survival course of the four experimental groups measured by the Kaplan-Meier estimator. NS, not significant; BMT, bone marrow transplantation; T-MSC, tonsil-derived mesenchymal stromal cell; Bu, busulfan; Cy, cyclophosphamide.
Clustering TCR-beta chain sequence and repertoire diversity
We analyzed TCR-beta V and J genes from the thymus and spleen using the iRepertoire TCR-beta sequencing panel (https://www. irepertoire.com) after BMT to compare the effect of TCR chain repertoires and diversities. For the comparison of TCR repertoires, the frequencies of V and J genes were analyzed using R (http://www.R-project.org) program by the clustering method from the thymus and spleen. The most frequently expressed V genes were clustered into two groups according to the origin of T cells, i.e., the thymus or spleen, but not depending on T-MSC treatment (Fig. 2A). We compared the splenic TCR repertoires of the experimental groups by TCR-beta chain sequencing. The squares represent areas of clonal expansion within the sample (Fig. 2B). The control (no treatment) group showed the least amount of TCR repertoire diversity on day 3 post-BMT among all groups. However, the BMT+T-MSC group showed the least TCR diversity (D50 = 4.9) at 40 days after the cell transfer.
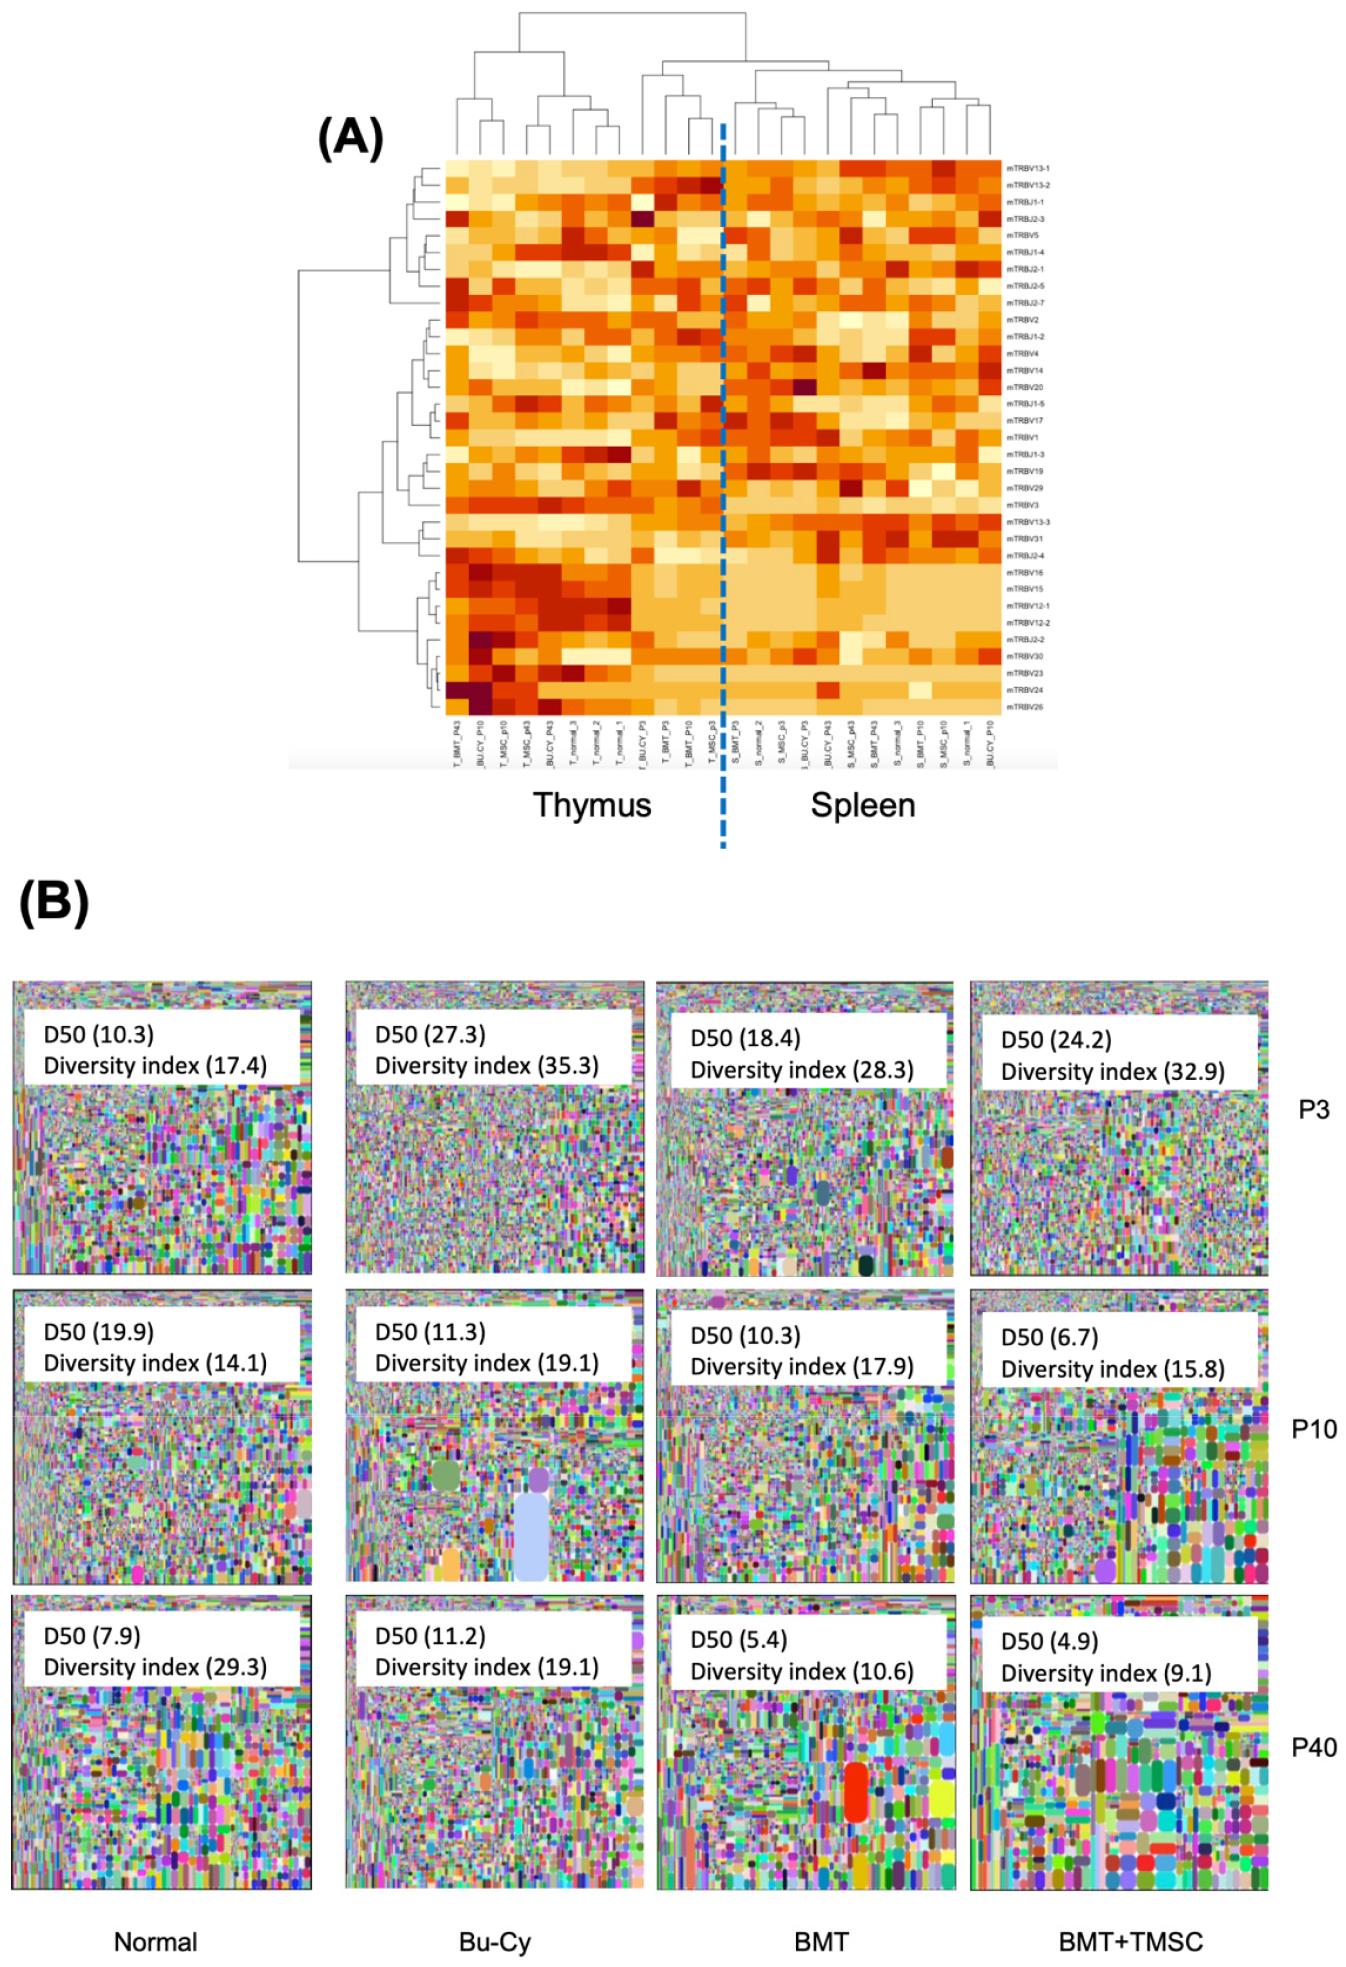
Fig. 2
T cell receptor (TCR)-beta sequencing. The resulting sequences were analyzed using the iRepertoire TCR-beta sequencing panel (https://www. irepertoire.com). (A) For the comparison of TCR-beta V and J genes from the thymus and spleen, the frequencies of V and J genes were analyzed using the clustering method (https://www.R-project.org/). (B) Spleen tissue samples were collected on days 3, 10, and 40 following BMT. In the tree maps, each rounded rectangle represents a unique entry, and the area of the rectangle represents its relative frequency. The D50 value represents the relative CD3-based T cell diversity of the library. BMT, bone marrow transplantation; T-MSC, tonsil-derived mesenchymal stromal cell; Bu-Cy, busulfan-cyclophosphamide.
Infiltration rate of CD3+ T cells from C57BL/6 donor mice
We analyzed the proportion of CD3+ T cells originating from donor mice (H-2Kb+ cells) in the spleen by flow cytometry to compare the effect of T-MSCs on the infiltration or recruitment of CD3+ T cells into the spleen. In the spleen, the BMT group showed a higher infiltration of donor CD3+ T cells compared to the BMT + T-MSC-injected group (Fig. 3A). Furthermore, the BMT group demonstrated a higher infiltration of H-2Kb CD4+ T cells and H-2Kb CD8+ T cells (Fig. 3B and 3C). Therefore, we speculated that T-MSCs treatment decreased the recruitment of CD3+ T cells to the spleen.
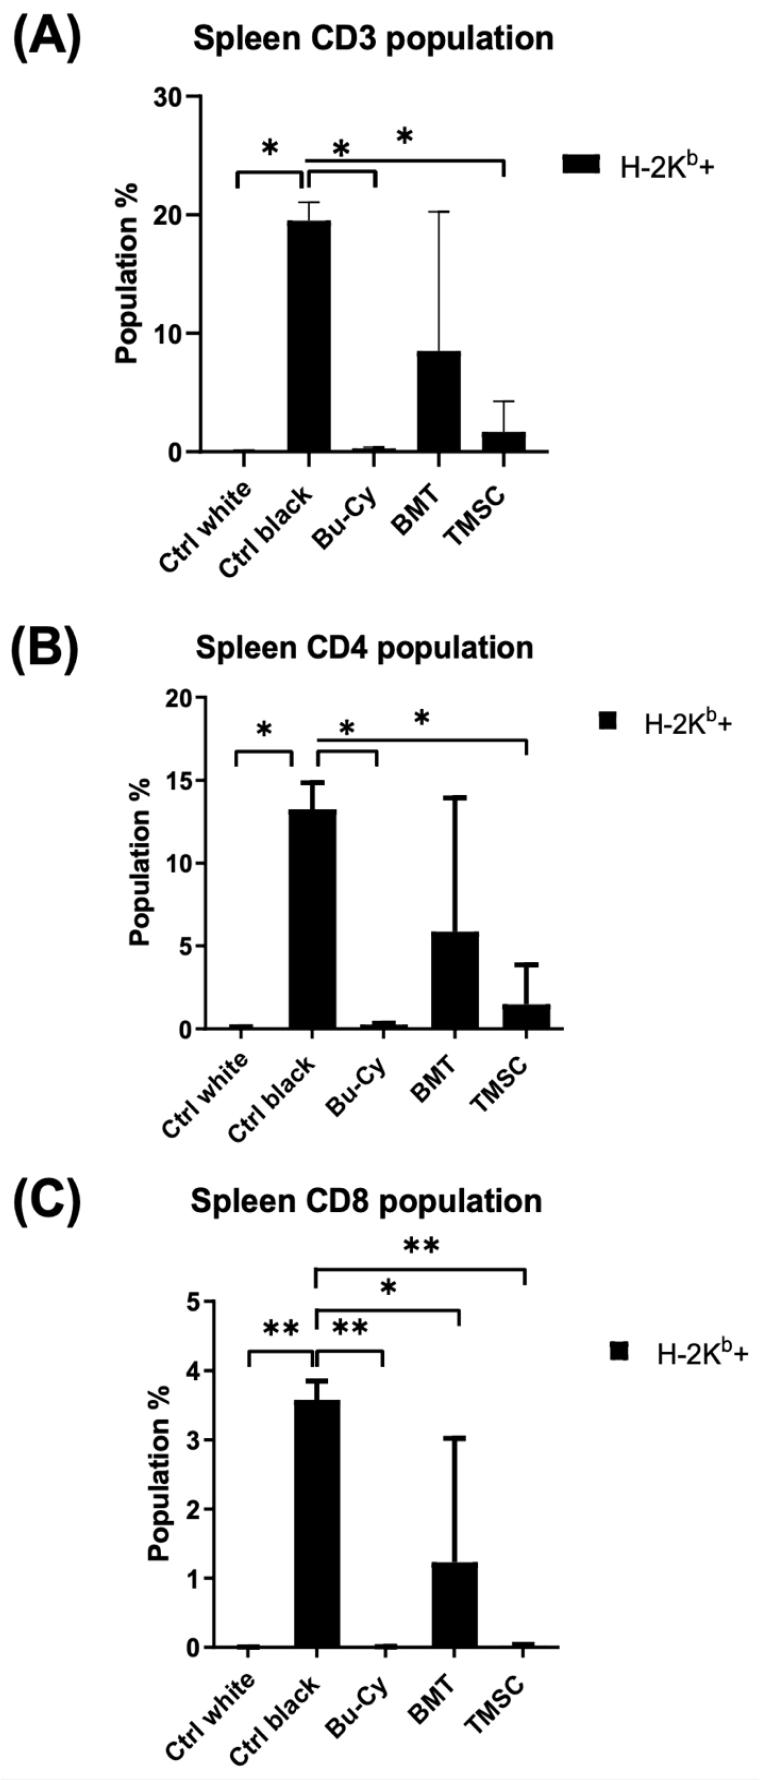
Fig. 3
Detection of H-2Kb cells in the spleen after BMT. Proportions of (A) CD3+ T cells, (B) CD4+ T cells, and (C) CD8+ T cells were analyzed by a flow cytometer (n = 3) and compared by two-way analysis of variance (ANOVA) with multiple comparisons. *P < 0.05, **P < 0.01. Ctrl white, no treatment group of Balb/c mice; Ctrl black, no treatment group of C57BL/6 mice; Bu-Cy, pre-conditioning with busulfan-cyclophosphamide group; BMT, BMT after Bu-Cy pre-conditioning; TMSC, co-transplantation of T-MSCs with BMT.
CD69 expression in the spleen
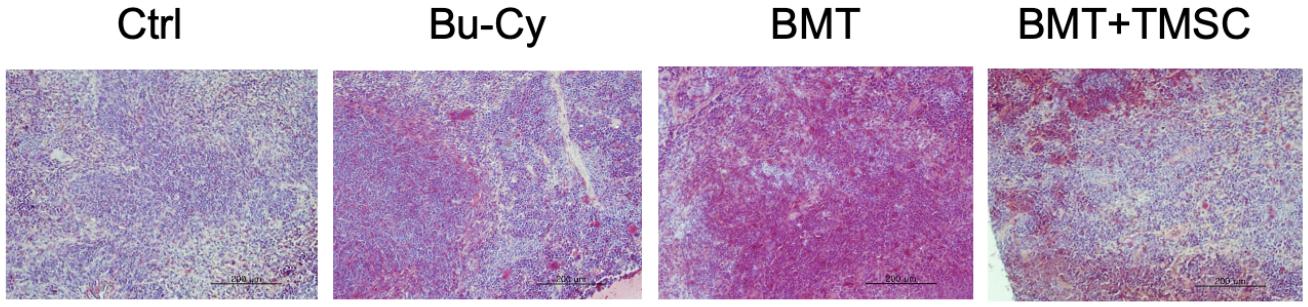
Regarding T cell migration into the spleen, CD69 expression is involved in the retention of activated T cells within the tissue. We stained spleen tissues with anti-CD69 antibody to compare the expression of CD69 in the spleen among Bu-Cy, Bu-Cy + BMT, or Bu-Cy + BMT + T-MSC groups (Fig. 4). The images were analyzed for CD69+ cells with ImageJ software (https://imagej.net/ij/), and mean pixel densities of CD69+-stained area were 108.9 (control), 127.7 (Bu-Cy), 141.1 (BMT), and 122.2 (BMT+T-MSC), respectively. Thus, CD69 expression was the highest in the BMT group.
The effect of T-MSC on the expression of CD62L, CD69, and VLA-4
We injected T-MSCs into C57BL/6 mice and collected their blood and spleen after 7 days to compare the effect of T-MSC injection on the expression of CD62L, CD69, and VLA-4 (Fig. 5A). Although the blood showed a higher amount of CD62L+ cells (Fig. 5B), these decreased under the T-MSC treatment (Fig. 5C).
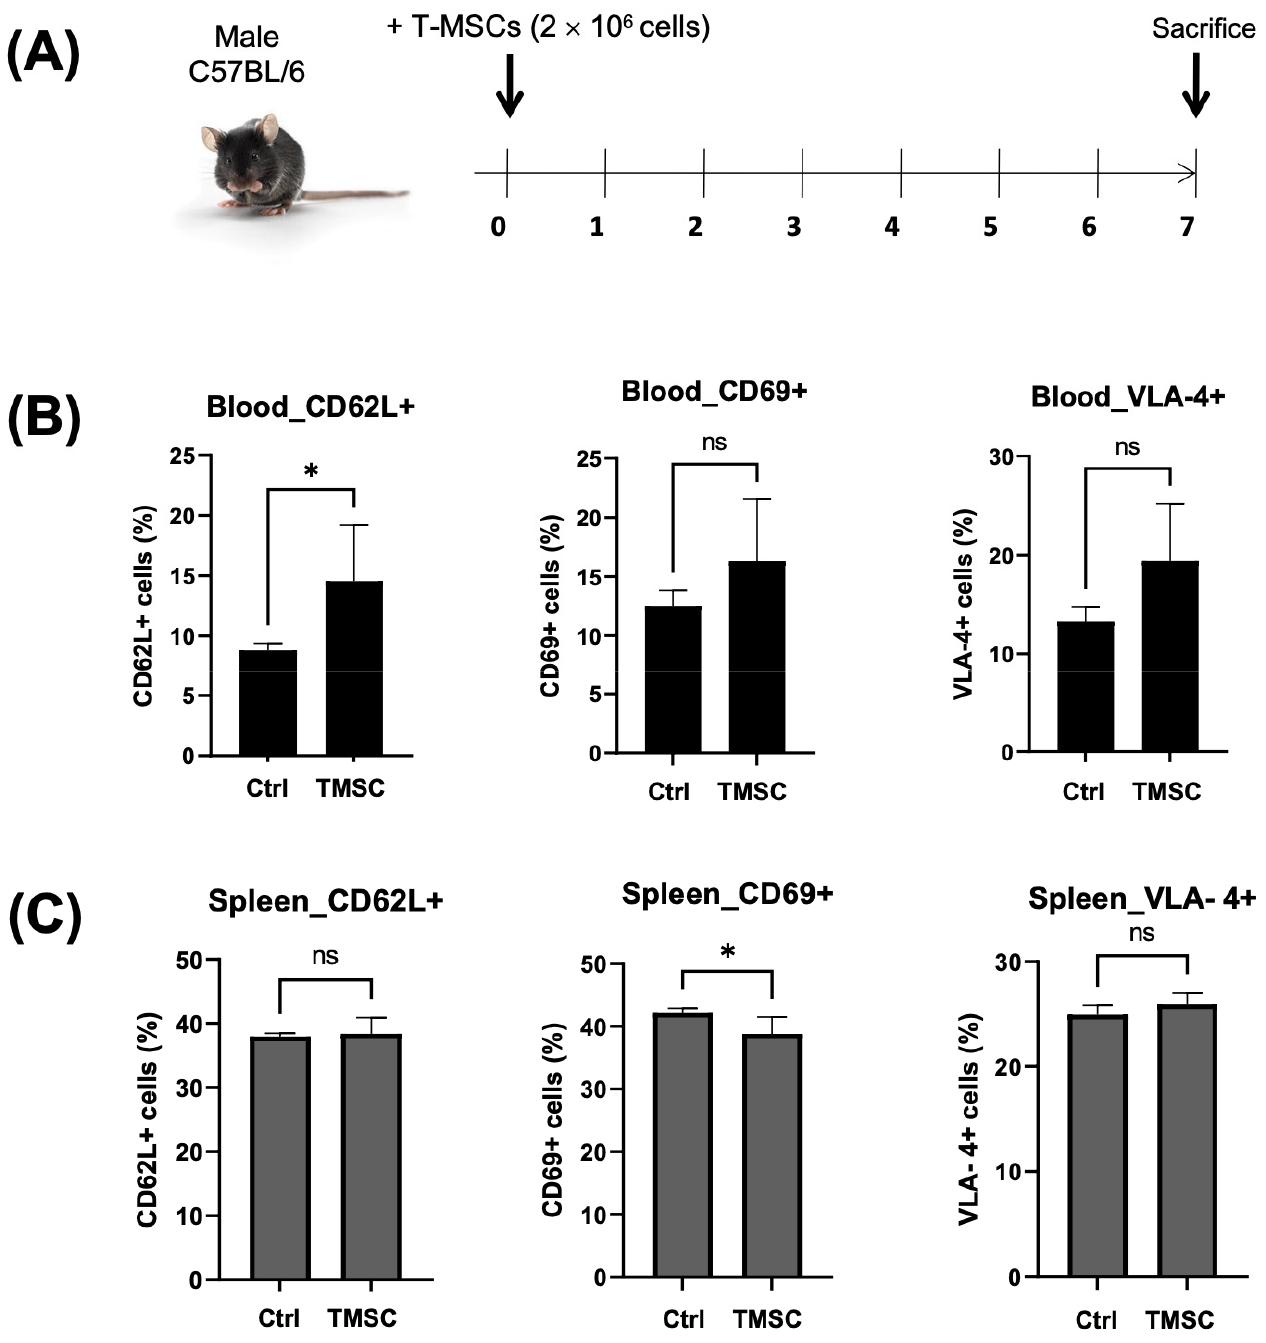
Fig. 5
In vivo detection of CD62L, CD69, and VLA-4 cells in T-MSC-injected C57BL/6 mice. (A) T-MSCs (2.5 × 10⁶ cells) were systemically injected into the tail vein of C57BL/6 mice. After 1 week, the cells were isolated from mice’s (B) blood and (C) spleen, followed by the analysis of CD62L-, CD69-, and VLA-4-positive cells by flow cytometry. Statistical significance was determined by t-test for comparison between the two groups (n = 3). *P < 0.05.
Gene expression profile of T cells after co-culturing with T-MSCs
We performed real-time PCR to analyze cytokine and chemokine expression of T cells after co-culturing with T-MSCs. T-MSC co-cultured splenic T cells showed a decreased expression of chemokine (C-C motif) receptor-like 2 (CCRL2), chemokine-binding protein 2 (ACKR2), interferon-gamma (IFNG), Toll-like receptor 4 (TLR4), chemokine (C-X-C motif) receptor 2 (CXCR2), chemokine (C-C motif) ligand 5 (CCL5), chemokine (C-C motif) receptor 5 (CCR5), interleukin 4 (IL4), and chemokine (C-C motif) ligand 20 (CCL20). In contrast, the cells demonstrated an increased expression of chemokine (C-X-C motif) ligand 9 (CXCL9), beta-actin (ACTB), chemokine (C-X-C motif) receptor 6 (CXCR6), chemokine (C-C motif) receptor 9 (CCR9), chemokine (C-C motif) receptor 4 (CCR4), chemokine (C-C motif) ligand 28 (CCL28), and mitogen-activated protein kinase 1 (MAPK1) (Fig. 6).
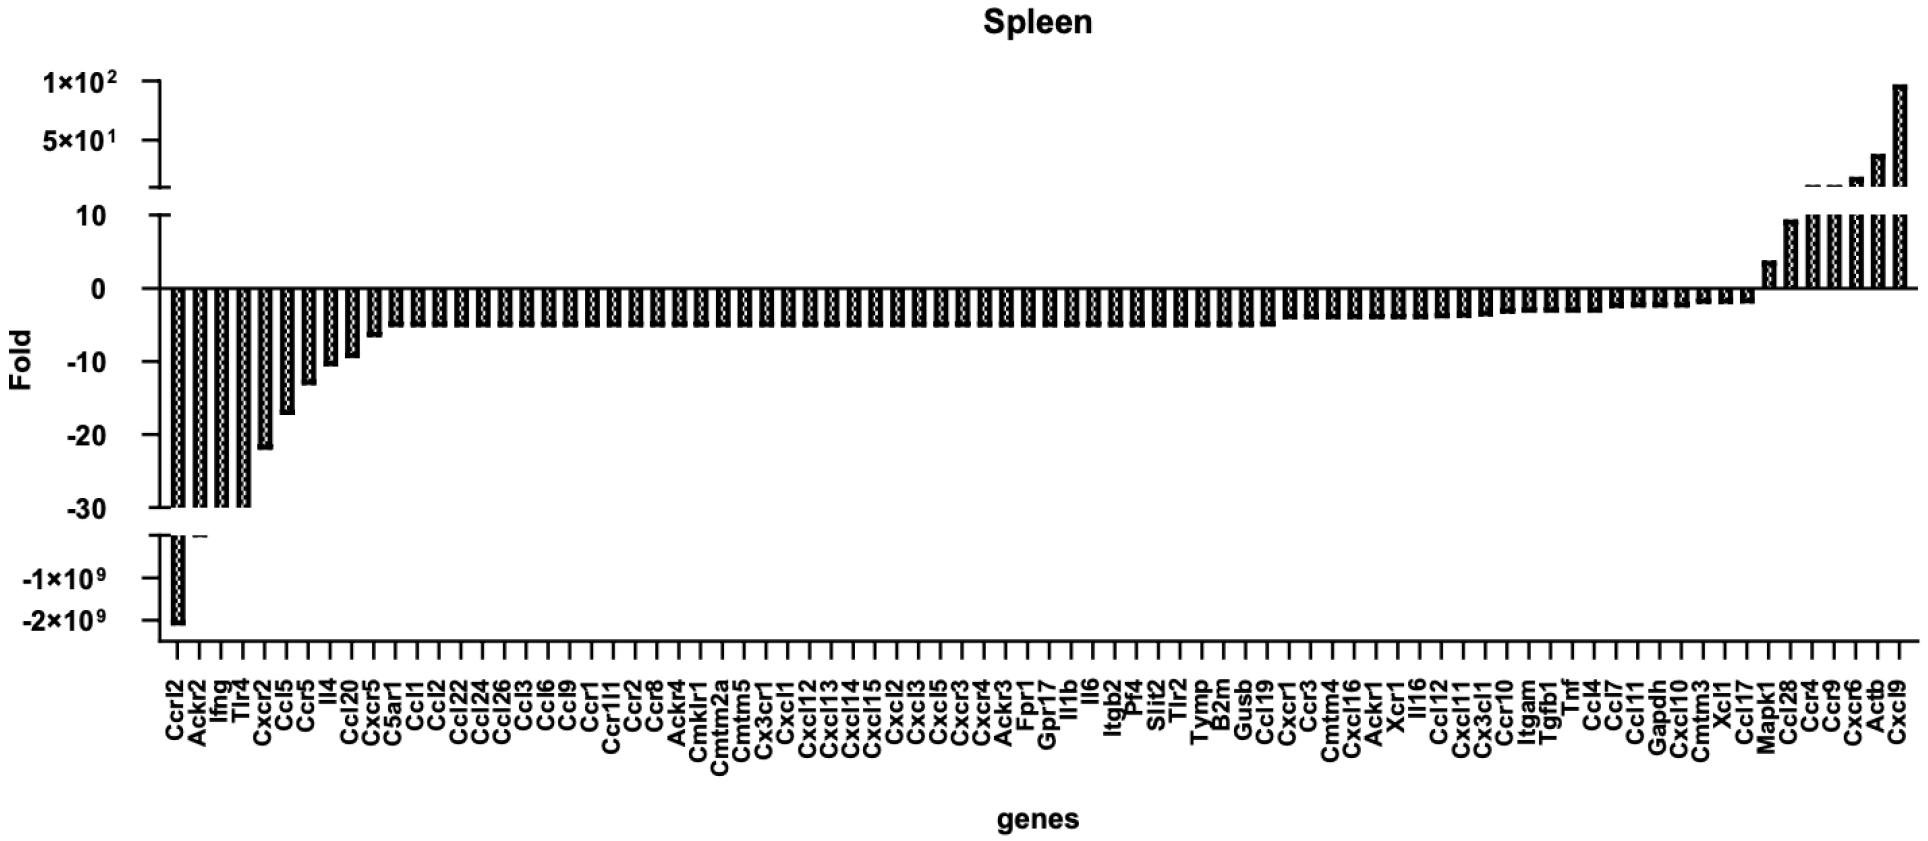
Fig. 6
Expression changes of chemokines (and receptors) in T cells after T-MSC treatment. Male C57BL/6 mice were sacrificed (n = 3), and the spleens were isolated for T cell separation. T cells (1 × 10⁷ cells, upper wells) were co-cultured with or without T-MSCs (1 × 10⁶ cells, lower wells) in a transwell (pore size, 0.4 μm) for 24 h with IL-2. RNA was isolated, and a qPCR array was performed. Data were analyzed with the RT²Profiler.
DISCUSSION
Co-transplantation of T-MSCs in the allogeneic BMT model showed improved survival but decreased donor T cells in the spleen compared to those with only BMT. Lymphocyte engraftment success might be reflected by signs of recovery (e.g., weight gain or survival rate and complete blood count) and complications (e.g., infections or bleeding). In this study, after co-transplantation of T-MSCs and BM cells, weight gain or survival of the mice were better (Fig. 1). However, populations of T cells in the thymus and spleen were different, in which thymic T cells and B cells possessed different T cell receptor repertoire (Fig. 2A). Since T cell repertoire diversity was lower in the co-transplantation group (Fig. 2B), we hypothesized that external MSCs might influence immune reaction in secondary organs, in this case, in the spleen.
As shown in Fig. 3, the proportion of CD3+ cells was lower in the MSC co-transplantation group. In the pre-condition only (Bu-Cy) group, there were no donor cells injected. The BMT group did not fully reach 100% engraftment (compared to controls). Therefore, we postulate the possibility of CD3+ T cell entrapment in organs other than the spleen or secondary lymphoid tissue in the MSC-treated group. Afterward, we stained the tissue to detect CD69 expression. The spleen demonstrated a high expression of CD69 in the BMT group (Fig. 4). We also evaluated the MSC effect of CD69 expression by T-MSCs in mice without Bu-Cy pre-conditioning or BMT. After 7 days, CD69-expressing cells decreased in the spleen (Fig. 5C). CD69 is a C-type lectin that counteracts sphingosine-1-phosphate (S1P1) signaling favoring Th1/Th17 polarization by promoting the internalization and degradation of the receptor (10). Additionally, CD69 stimulates the JAK3/STAT5 pathway counteracting STAT3-induced expression of IL-17 and promoting Treg development (8). CD69 associated with the LAT1-CD98 complex regulates the Th1/Th17/Treg balance. CD69, together with CD103, is a typical marker of peripheral tissue-resident memory (TRM) T cells (11). After T-MSC treatment, C57BL/6 mice had more CD62L+ cells in the blood but not in the spleen (Fig. 5B). Thus, T-MSC treatment might influence cell distribution and lymphocyte recirculation between lymphoid organs.
Finally, we performed the chemokine PCR array in vitro co-culture method. Briefly, splenic T cells co-cultured with T-MSCs showed increased and decreased expression of various molecules. For example, CXCL9 expression was increased. The encoded protein. involved in T cell trafficking, is a chemoattractant recruiting Th1 lymphocytes, but not neutrophils, to an inflammation site (12). CXCR6 binds to CXCL16 and is expressed in several T lymphocyte subsets (CD8+ T cells) and bone marrow stromal cells. It regulates T lymphocyte migration to various peripheral tissues (the liver, spleen red pulp, intestine, lungs, and skin) and promotes cell-cell interaction with dendritic cells and fibroblastic reticular cells (13). CCR9, binding to CCL25, guides the homing of T cells to the GI tract, thymic T cell development (14), and is involved in inflammatory diseases (e.g., inflammatory bowel disease). CCR4, binding to CCL17 and CCL22, is expressed on Th2 and Treg cells and regulates cell trafficking of various leukocyte types (15). CCL28, secreted by epithelial cells in various mucosal tissues, binds to CCR3 and CCR10 (16). MAPK1 (ERK2) acts as a transcriptional repressor of interferon-gamma–induced genes (17). MSC treatment decreased the expression of CCRL2 (ACKR5 and chemokine [C-C motif] receptor-like 2), a gene with unknown function that is highly expressed in neutrophils and monocytes (18); ACKR2 (atypical chemokine receptor 2), a gene expressed in lymphatic endothelial cells and overexpressed in vascular tumors, playing a role in chemokine-driven recirculation of leukocytes and possible chemokine effects on the development and growth of vascular tumors (19); CXCR2, encoding a receptor for interleukin 8 (IL8) that mediates neutrophil migration to the inflammation site (20). Furthermore, this receptor mediates the angiogenic effects of IL8 in intestinal microvascular endothelial cells. Additionally, MSC treatment decreased the expression of CCL5 (RANTES), which, binding to CCR5, is a chemoattractant for blood monocytes, memory T-helper cells, and eosinophils that causes the release of histamine from basophils and activates eosinophils. CCR5 is expressed in T cells and macrophages and participates in T lymphocyte migration to the infection site, acting as a chemotactic receptor (21).
In summary, this study demonstrated the immune modulatory effects of MSCs, which regulate lymphocyte migration in the peripheral lymphoid tissues by secreting chemokines, inducing chemokine receptor expression, or CD69-mediated regulation. The possible mechanism of MSCs on lymphocyte recruitment requires elucidation using a systemic or local inflammation animal study.
