

INTRODUCTION
Hospitalized patients are at a high risk of acquiring bloodstream and other infections from Gram-positive bacteria. An increasing number of nosocomial bloodstream infections (BSIs) are caused by antibiotic-resistant Gram-positive bacteria. Methicillin-resistant Staphylococcus aureus and vancomycin-resistant enterococci (VRE) are significant pathogens that cause infections (1). The persistent increase in healthcare-associated infections is attributed to the global proliferation of multidrug-resistant (MDR) pathogens, growing population of immunocompromised individuals, escalating complexity of medical care, and deficiencies in antibiotic therapy administration regarding dosage and duration. In 2017, the World Health Organization published a list of bacteria requiring new medications, including high-priority pathogens (e.g., vancomycin-resistant Enterococcus faecium and methicillin-resistant, vancomycin-intermediate/resistant strains of S. aureus) (2).
Colonization is defined as the presence of germs on a bodily surface (such as the skin, oral cavity, intestines, or respiratory tract) that do not cause disease in the individual. Infection refers to the incursion of pathogenic organisms into the body tissues of a host organism. It arises from the interaction between microorganisms and the host defenses they invade (3). Timely diagnosis and appropriate antibiotic therapy are crucial for mitigating morbidity and mortality in patients with BSIs. Blood culture, the established gold standard for bacterial identification in blood, takes a minimum of 24–48 h and demonstrates inadequate sensitivity when performed during the patient’s antibiotic treatment (4).
False-positive blood culture test findings are common and result from contamination by extraneous organisms, such as skin or environmental contaminants, introduced into the obtained blood sample (5). False-positive results can lead to misdiagnoses, unnecessary follow-up procedures, and inappropriate therapies, thereby exerting considerable adverse effects on patients and increasing healthcare cost (6). Urine culture analysis may be complicated by contamination. Contamination may occur during the collection phase from neighboring vaginal, perineal, and epidermal skin flora before sample processing (7). Rapid diagnostic tests for infectious disorders that yield results in under 2 h can enhance patient care, optimize antibiotic utilization, and bolster infection control in the emergency department (8).
The past few years have seen a growing interest in biomarkers that could improve the detection of Gram-positive, MDR bacterial infections. Lipoteichoic acid (LTA) and soluble urokinase plasminogen activator receptor (suPAR) are the prospective alternatives. LTA is an important part of the cell wall of Gram-positive bacteria. It reportedly triggers strong immune responses and may be used to identify Gram-positive infections (9).
LTA adheres to the surface of Gram-positive bacteria and controls the activity of muramidases, which break down the cell walls. It typically emerges from bacterial cells when lysozymes, the cationic peptides of leukocytes, or beta-lactam antibiotics degrade them. It binds to target cells either nonspecifically to membrane phospholipids or specifically to CD14 and Toll-like receptors (10). LTA contributes to the emergence of inflammation by activating nuclear factor kappa B via toll-like receptor 2 (TLR2) and enhancing the transcription of proinflammatory cytokines, including IL-6, the primary cytokine responsible for hepcidin production (11).
suPAR is the active form of uPAR and is a membrane-associated glycoprotein mostly found on the surface of immune cells. It has shown promise as a predictive biomarker in many infectious disorders, including bacterial sepsis (12), indicating local inflammation and immunological activity. Increased suPAR levels have been associated with illness severity, recurrence, and mortality in various conditions, including cancer, diabetes, cardiovascular diseases, renal disorders, and inflammatory diseases (13).
The clinical significance of the finding arises from the synergistic function of LTA and suPAR in overcoming the limitations of conventional diagnostics. LTA, a constituent of Gram-positive bacterial cell walls, facilitates the differentiation between colonization and active infection by correlating with microbial load and invasion. However, it does not identify specific pathogens. Conversely, suPAR acts as a broad but vague indicator of systemic immune activation, reflecting disease severity without revealing the etiology. This dual method, incorporating two markers, represents a more thorough diagnostic instrument: LTA confirms the presence of Gram-positive bacteria and the condition of infection, whereas suPAR elucidates the host’s inflammatory response (12). This collaboration enhances the prompt detection of authentic BSIs, reduces reliance on time-consuming culture methods, and alleviates misclassification between colonization, infection, and sterile inflammation. Prior evidence supports this strategy; for example, a previous study (14) demonstrated improved BSI detection when LTA and suPAR were used together rather than individually. If validated, this approach could provide clinicians with a rapid, selective tool to facilitate antibiotic therapy, which is particularly crucial in an era of escalating antimicrobial resistance. This research effort is aimed at evaluating the assessment of sensitivity, specificity, and overall diagnostic efficacy. This study seeks to advance the development of quicker and more precise diagnostic instruments for these intricate infections and enhance the ability to distinguish between bacterial colonization and active infection.
MATERIALS AND METHODS
Patients and Bacterial Pathogens
A case–control study involving 100 participants was conducted from October 2024 to January 2025. The patients were classified into two groups: one group consisting of 62 patients diagnosed with Gram-positive bacterial infections and the other group comprising 38 healthy individuals with no prior history of bacterial infection (control group). The medical professionals at Al-Imam Al-Hussain Hospital and Al-Kafeel Specialized Hospital determined that they had bacterial infection based on their symptoms and lab diagnosis. The patient group was categorized into several subgroups: 27 patients with sepsis, 8 with diabetic foot ulcer (DFU), 9 with urinary tract infection (UTI), 8 with wound infection, 3 with vaginitis, 3 with abscess, and 4 with pneumonia.
The VITEK 2 system (bioMérieux) was used for the identification and antibiotic susceptibility testing of Gram-positive cocci. There were 62 different types of clinical isolates, including 20 S. aureus, 20 coagulase-negative staphylococci, 15 Enterococcus spp., 3 Streptococcus agalactiae, 2 Streptococcus pneumoniae, and 2 Streptococcus anginosus. The AST VITEK system (antimicrobial susceptibility testing) determines the resistance profile of bacterial isolates by assessing their susceptibility to several antimicrobial agents, including MDR, extensively drug-resistant (XDR), and pandrug-resistant strains.
Inclusion and Exclusion Criteria
Inclusion criteria for the case group
Patients must be aged ≥18 years old and exhibit symptoms of a Gram-positive bacterial infection. They must also fulfill a minimum of two supplemental criteria: fever above 38°C, high leukocyte count (leukocytosis), or specific organ-related symptoms, including respiratory, dermatological, or systemic signs related to the infection.
Inclusion criteria for the control group
The control group comprised individuals with no active infections, chronic inflammatory diseases, or comorbidities, as confirmed by their medical history and laboratory assessments. Their health status was additionally confirmed via laboratory testing, including C-reactive protein, white blood cell count, and procalcitonin, and clinical evaluations. The participants were matched to the case group based on age and sex. Furthermore, they had not used antibiotics in the previous 30 days to prevent antimicrobial impact on their health condition.
Exclusion criteria
The exclusion criteria included age below 18 years, presence of autoimmune disorders, pregnancy, catheter use, and presence of prostate issues (men). Furthermore, individuals who had immunocompromised conditions, have recently undergone major surgical procedures (within the last 30 days), and who had diagnosed malignancies were excluded from the study. These criteria guarantee the safety and integrity of the study by reducing potential dangers and confounding variables.
Sample Collection
Samples were collected within 24 h of hospital admission for all participating patients, establishing a uniform time point for the initial biomarker assessment. Samples were collected prior to the initiation of antibiotic therapy, guaranteeing that biomarker levels were evaluated in a treatment-naïve condition. In this study, urine and blood samples as well as swabs for the isolation and identification of microorganisms were collected. A loopful of the substance was extracted from the well-mixed colony and placed onto MacConkey and blood agars. Then, the samples were incubated overnight at 37°C in bacteriological incubators under aerobic conditions. In addition, blood samples were obtained to assess the LTA and suPAR levels for each precipitant.
Quantification of Serum suPAR and LTA Using Validated ELISA Methods
The serum levels of suPAR and LTA were measured using commercially available ELISA kits (Human Soluble Urokinase Plasminogen Activator Receptor ELISA Kit, Cat. No E3759Hu; Human Lipoteichoic Acid ELISA Kit, Cat. No EA0200Hu) according to the manufacturer’s protocols. All samples were analyzed in duplicate, with absorbance measured at 450 nm using a microplate reader.
The LTA ELISA demonstrated an exceptional analytical performance: intra-assay coefficient of variation (CV) < 10% (n = 6 duplicates), inter-assay CV <12% (3 runs), spike recovery of 90%–110%, linearity ranging from 0.5 to 32 ng/mL (R2 > 0.99), sensitivity (LOD = 0.22 ng/mL), and specificity (<5% cross-reactivity). The suPAR ELISA showed an intra-assay CV of 8.0%, inter-assay CV of 9.5%, recovery rate of 95%–105%, linearity spanning 5–1900 ng/L (R2 > 0.99), and limit of detection of 3.82 ng/L, with cross-reactivity below 5%.
The following stringent quality control protocols were implemented: (1) immediate sample centrifugation (3000 × g, 15 min, 4°C) and storage at −80°C in single-use aliquots; (2) randomized plate arrangements to reduce batch effects; (3) integration of manufacturer standards and internal controls on every plate; (4) dual-technician assessment with an inter-operator CV <5%; and (5) automated detection and reassessment of out-of-range values. The approaches yielded mean recovery rates of 94%–103% for suPAR and 91%–107% for LTA, thereby confirming the dependability of the assay for clinical and research applications.
Ethical Clearance
A case–control study was conducted in collaboration with the medical administrations of Imam Al-Hussain Hospital and Al-Kafeel Specialized Hospital. Samples that had been ethically cleared by the Ethics Committee of the Kerbela Health Office were used. The study protocol, subject data, and consent forms were reviewed and approved by a local ethics committee, as indicated in permission number 3003 dated September 11, 2023.
Statistical Analysis
In the statistical analysis, IBM SPSS Statistics was used to compute the mean and standard deviation (SD). A significance level of p < 0.05 was used for the result evaluation. Analysis of variance was employed for multiple group comparisons, followed by Duncan’s post hoc test to assess differences among the groups at the same significance level. Receiver operating characteristic (ROC) curve analysis was employed alone to determine the optimal cutoff values for suPAR and LTA by maximizing the sum of sensitivity and specificity (Youden’s index), ensuring a balance between true positives and true negatives. Increased area under the curve (AUC) values for both biomarkers demonstrated substantial discriminating power.
RESULTS
Comparison of the Biomarker Levels of the Patient Groups
The LTA levels were significantly different among the patient groups, with a p-value > 0.05. The diagnoses and their corresponding mean LTA levels were as follows: sepsis, 47.68; UTI, 47.32; DFU, 45.86; pneumonia, 44.59; vaginitis, 43.12; wound infection, 60.62; and abscess, 29.94. The highest mean LTA level was observed in patients with wound infection (60.62 ± 9.44), whereas the lowest was recorded in those with abscess (29.94 ± 4.54) (Fig. 1).
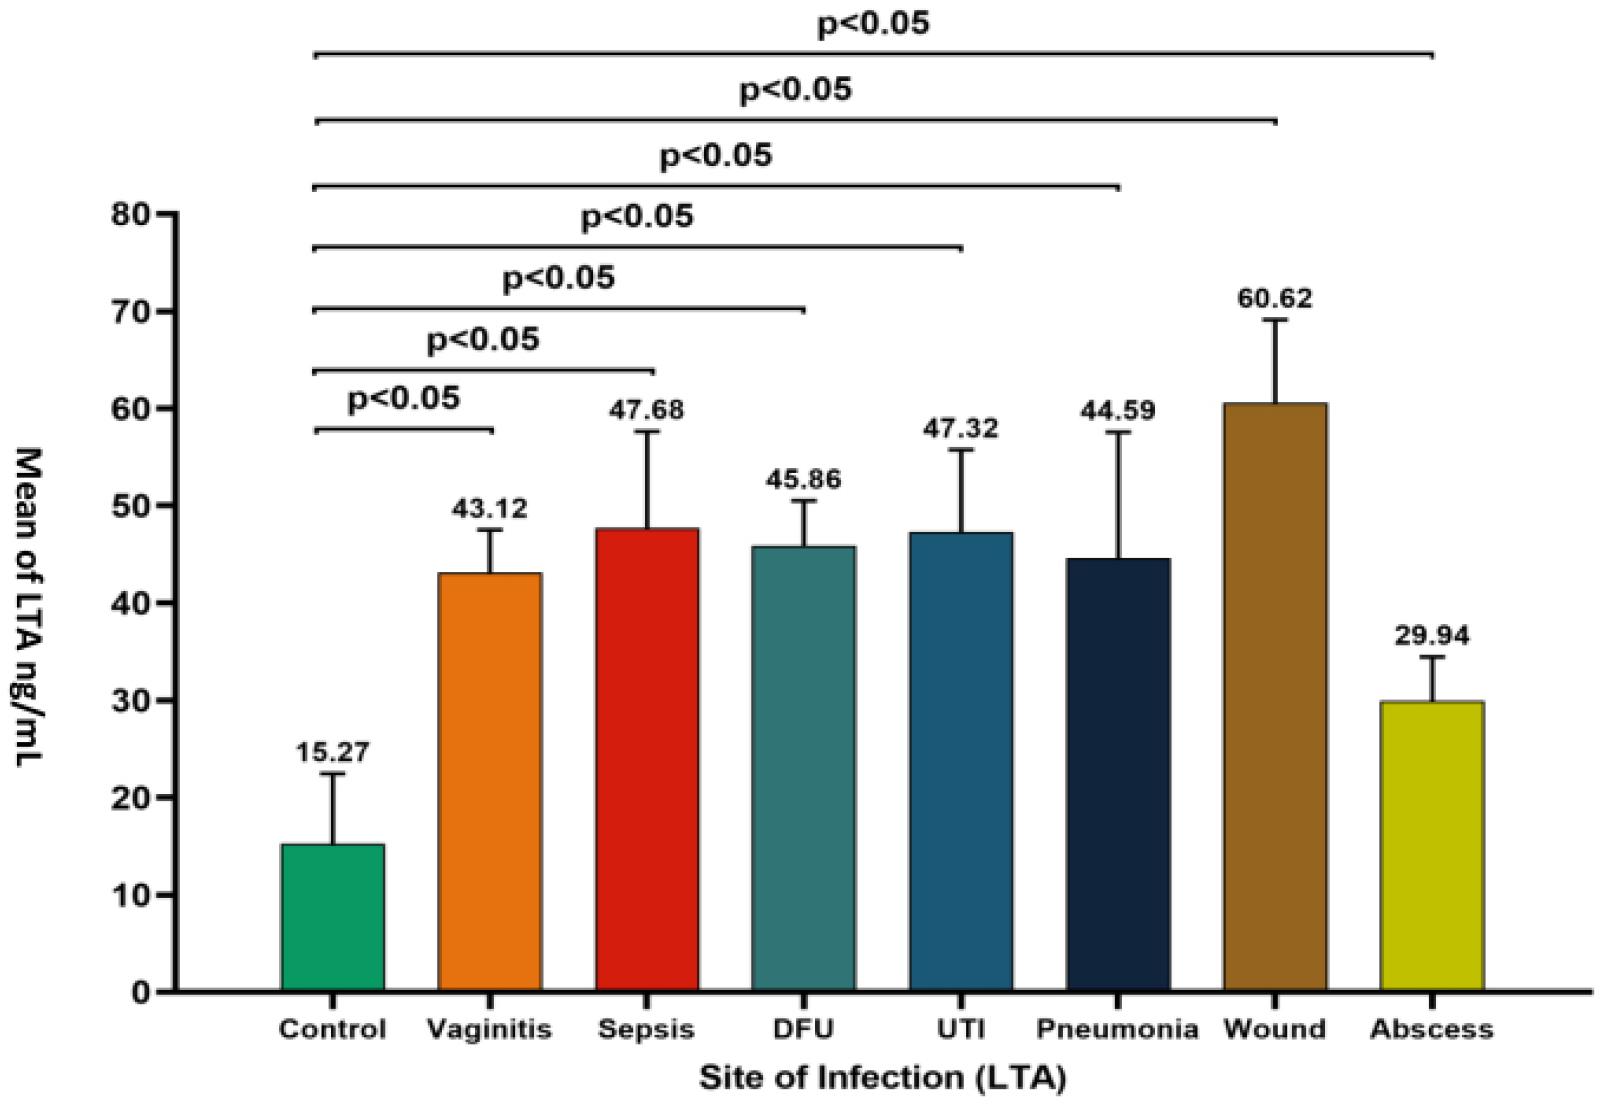
Fig. 1
Comparison of LTA levels across different infection sites. The bar graph presents the mean LTA levels for various infection sites, including control (no infection), vaginitis, sepsis, diabetic foot ulcer (DFU), urinary tract infection (UTI), pneumonia, wound, and abscess. All infection groups exhibited significantly higher LTA levels than the control group (P < 0.05).
Fig. 2 presents the mean suPAR levels across various infection sites in comparison with the control group (120.67), demonstrating significant elevations (*p* < 0.05) in sepsis (231.97), DFU (243.53), UTI (250.49), pneumonia (197.77), wound infection (257.05), and abscess (191.85), with the highest levels observed in vaginitis (300.47). Pneumonia and abscess were the conditions that exhibited no statistically significant change from the control (ns). The results indicated that the levels of suPAR and LTA are elevated in several types of infections, with strong correlations particularly observed in systemic or severe localized infections, such as wound infection, highlighting their potential as biomarkers for infection severity or type.
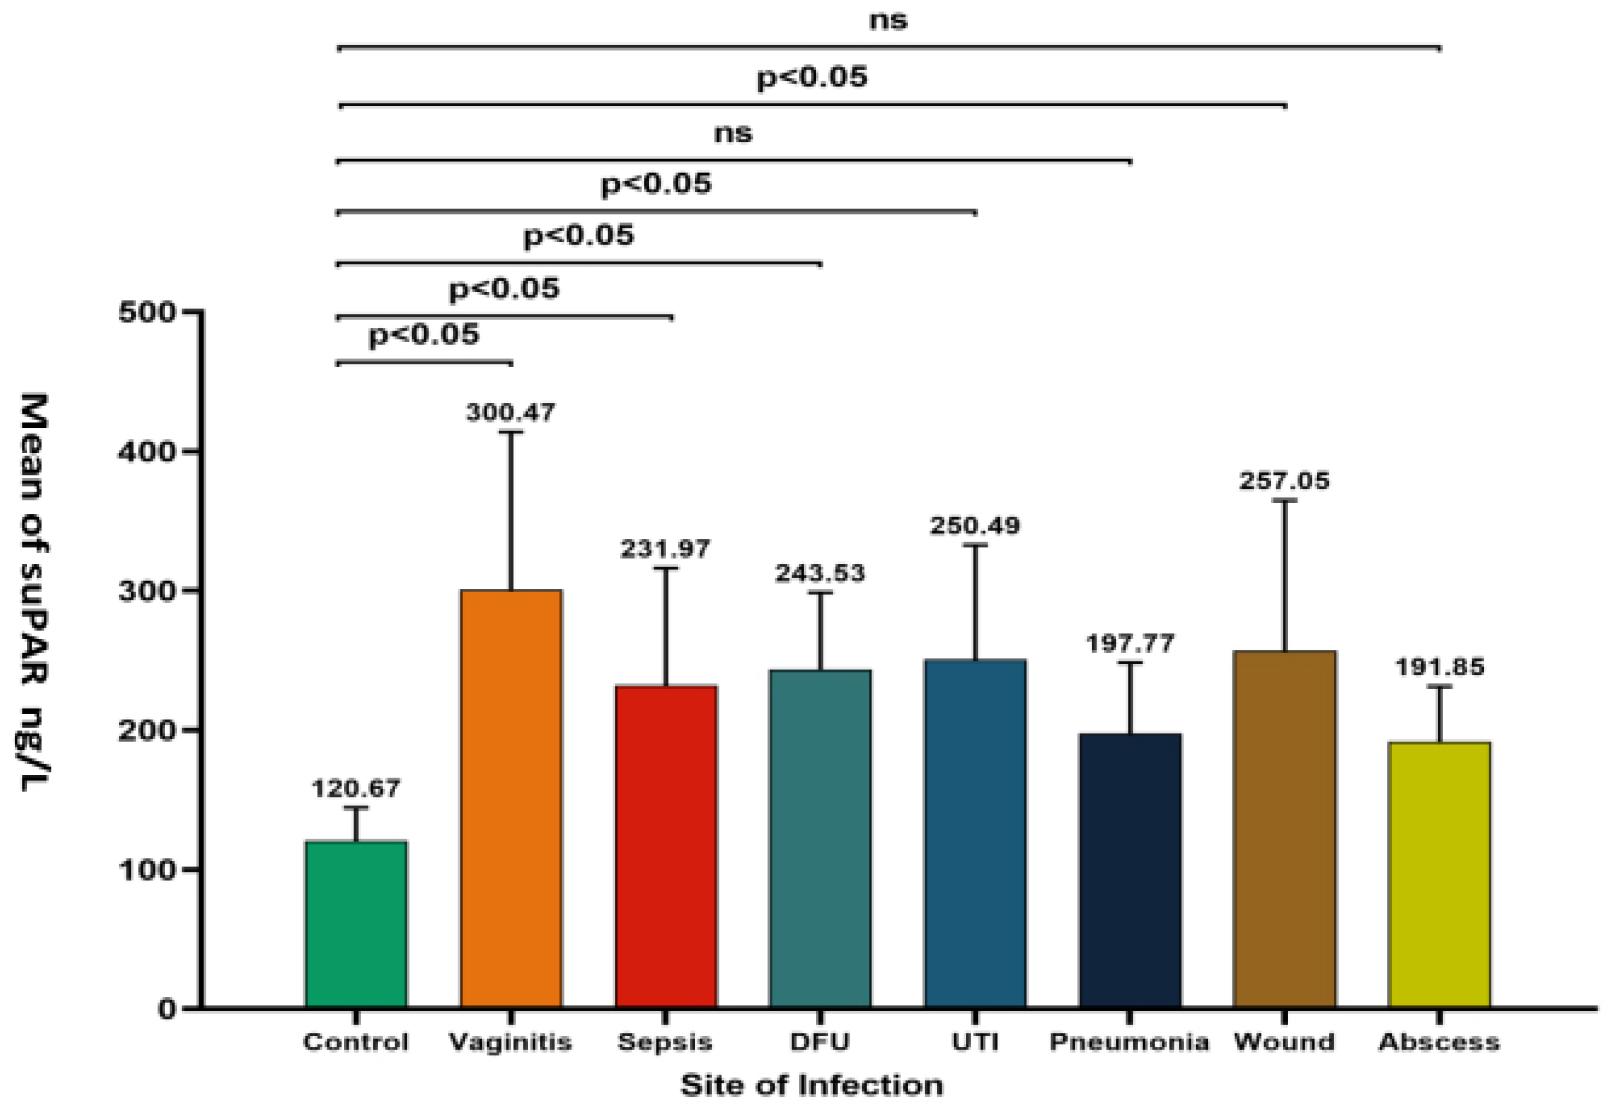
Fig. 2
Comparison of suPAR levels across different infection sites. The bar graph displays the mean suPAR levels for various infection sites, including control (no infection), vaginitis, sepsis, diabetic foot ulcer (DFU), urinary tract infection (UTI), pneumonia, wound, and abscess. Statistical significance (p < 0.05) is indicated for comparisons where the suPAR levels significantly differ from the Control group. “ns” denotes nonsignificant differences.
Categorization of Pathogens According to Antibiotic Susceptibility Testing
Eight pathogens were identified from the data of cultures that exhibited growth. The bacterial pathogens were divided into three groups based on the level of their resistance, namely, not multidrug-resistant (NOT MDR), MDR, and XDR, which make up 43.55%, 37.10%, and 19.35% of the total, respectively. S. aureus was the most common pathogen, detected in 44.44% of non-MDR cases, followed by E. faecalis, detected in 18.52%, and then S. hominis, E. faecium, S. pneumoniae, and S. anginosus, each detected in 7.41%. S. haemolyticus and S. agalactiae were also detected in a few cases. For MDR cases, S. hominis had the highest prevalence at 30.43%, followed by S. aureus and S. haemolyticus, both at 21.74%. E. faecalis, E. faecium,and S. agalactiae were also present at comparable levels, whereas S. pneumoniae and S. anginosus demonstrate no evidence of MDR. Ultimately, for XDR cases, E. faecium, S. aureus, and S. hominis were the most prevalent, all at 25.0%, followed by S. haemolyticus and S. agalactiae. In contrast, S. pneumoniae, S. anginosus, and E. faecalis exhibited no characteristics of being XDR, as presented in Fig. 3.
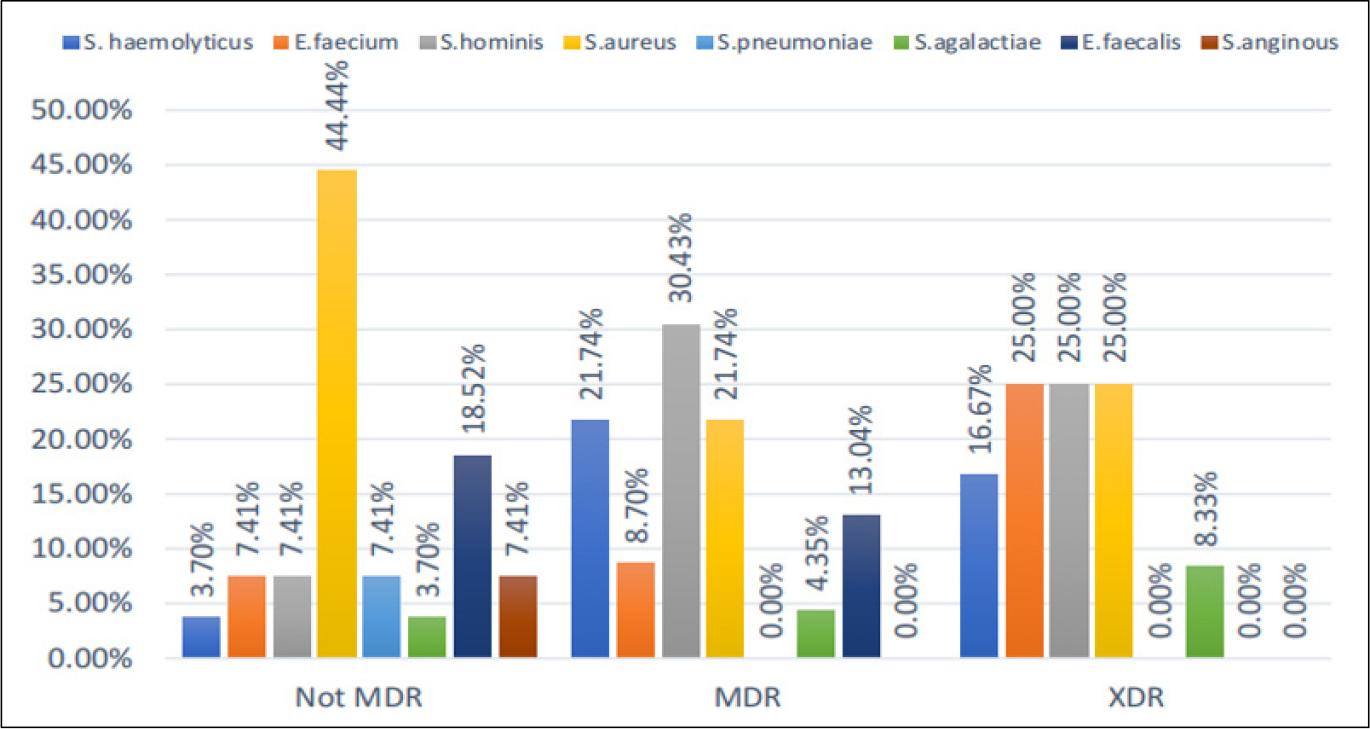
Fig. 3
Pathogen distribution and resistance profiles. The stacked bar graph showing the proportion of non-MDR and MDR isolates among bacterial species (e.g., S. haemolyticus, E. faecium) with their respective prevalence percentages. Key definitions (MDR, multidrug resistance; XDR, extensive drug resistance).
Comparison of Biomarker Levels (LTA and suPAR) Among the Control and Patient Groups According to Pathogen
The LTA levels in all pathogen groups were significantly different (0.0002) from those in the control group (15.27 ± 7.17). The pathogen group with the highest mean LTA level was S. haemolyticus at 52.66 ± 7.98, followed by S. hominis and S. aureus, both at 46.82 ± 12.26, E. faecalis at 44.53 ± 5.51, S. agalactiae at 43.73 ± 4.69, and S. pneumoniae at 42.50 ± 15.34. In contrast, S .anginosus had the lowest but still elevated level (40.50 ± 19.09) compared with the control group. As regards suPAR, all pathogen groups had significantly higher levels (p = 0.0007) than the control group (120.67 ± 23.68). E. faecium showed the highest suPAR mean (282.98 ± 113.45), followed by S. haemolyticus (272.78 ± 93.91), E. faecalis (257.76 ± 94.86), S. anginosus (243.09 ± 28.49), and S. agalactiae (238.24 ± 118.19). Contrarily, S. aureus (212.48 ± 55.15) and S. pneumoniae (175.71 ± 49.09) had the lowest but still elevated levels compared with the control group, as presented in Table 1.
Table 1.
Comparison of biomarker levels (LTA) and (suPAR) among the control and patient groups according to pathogen
ANOVA and the Kruskal–Wallis test were used to compare the means across groups. The table presents the mean levels (with standard deviation) of two biomarkers—LTA (ng/mL) and suPAR (ng/L)—across different pathogen groups and a control group. Superscript letters (e.g., a,c) indicate significant differences (p < 0.05) between the groups, as determined by the post hoc tests. p-values (0.0002 for LTA and 0.0007 for suPAR) confirmed the overall significant differences across the groups.
Predictive Value of the suPAR and LTA Levels for the Patients
Statistical analysis for curves that use the two immunological markers used in the study (suPAR and LTA). The data included standard errors (0.004–0.005), asymptotic significance (0.001–0.002), and confidence intervals (CIs, lower bounds, 0.988–0.985). The analysis revealed high diagnostic accuracy for the two markers (96.739% and 95.652%, respectively), with AUC values exceeding 90% across all categories. While the sensitivity and specificity measurements ranged from 93.333% to 96.667%, the predictive values showed strong diagnostic potential, with negative predictive values consistently above 90.625%. For each marker, distinct cutoff points were established, i.e., 145.140 for suPAR and 29.200 for LTA, as shown in Table 2. In the ROC curve analysis, LTA and suPAR demonstrated excellent diagnostic performance and high efficacy in the detection of Gram-positive bacterial pathogens, with curves closely approaching the top-left corner, indicating high sensitivity and specificity, as shown in Fig. 4.
Table 2.
Diagnostic performance of the suPAR and LTA biomarkers based on receiver operating characteristic (ROC) analysis
The table compares the diagnostic accuracy of suPAR and LTA via ROC curve analysis to distinguish between infected and noninfected individuals. The area under the curve (AUC), sensitivity, specificity, accuracy, positive predictive value, and negative predictive value (NPV) are among the key metrics. For each biomarker, the statistical significance (p-values) and asymptotic 95% confidence intervals (CI) are presented. The best cutoff values for suPAR and LTA (145.140 and 29.200, respectively) were established to achieve the highest level of diagnostic differentiation.
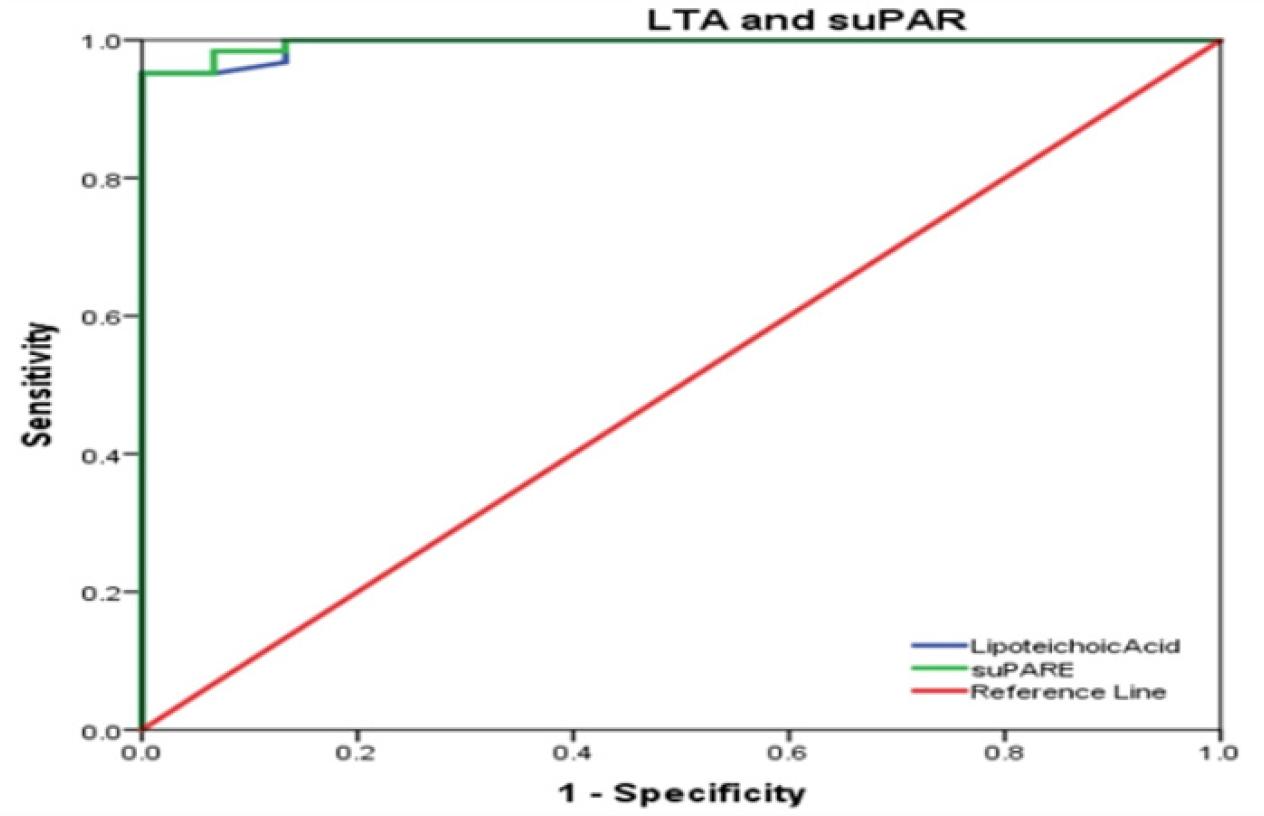
Fig. 4
Receiver operating characteristic (ROC) curves comparing LTA and suPAR. The diagnostic accuracy of the soluble urokinase plasminogen activator receptor (suPAR) and lipoteichoic acid (LTA) biomarkers was assessed using ROC curves. The reference line (AUC = 0.5) shows the random classifier’s performance. Each biomarker’s area under the curve (AUC) and 95% CIs are displayed. Sensitivity, or the true-positive rate, is represented by the y-axis, whereas specificity, or the false-positive rate, is represented by the x-axis. Higher AUC values indicate better discriminating ability of the biomarkers.
DISCUSSION
A strong cell wall is a characteristic of Gram-positive bacteria. The cell walls of bacteria protect them from antibiotics and other potentially dangerous compounds. Gram-positive bacteria can cause various infections, from severe respiratory illnesses to food poisoning. Certain Gram-positive bacteria produce toxins that can cause fatal diseases (15). In this study, patients infected with Gram-positive bacterial pathogens had high LTA levels than the control group. This finding is consistent with those of (16) that demonstrate the detection of LTA for the diagnosis of prosthetic joint infection of the bone by S. aureus. The LTA level in bacterial infection is greater in mice that had undergone surgery without bacterial inoculation. LTA can be a valuable diagnostic molecular imaging tool that can be used to distinguish between sterile inflammation and infection in prosthetic joint infection. Moreover, consistent with the findings of (17), which reported that patients with severe sepsis and septic shock had statistically significantly higher LTA levels, also serum proteins were in lower abundance. All bacterial pathogen groups exhibited markedly elevated suPAR levels compared with the control group. Consistent with the findings of (18), which reported that patients with prosthetic joint infection had markedly elevated suPAR levels compared with healthy controls, Gram-positive bacteria, particularly S. aureus, were reportedly the main cause of prosthetic joint infection.
The levels of LTA and suPAR in chronic wound infection are significantly higher than those in localized infections, such as abscess, reflecting a more pronounced Gram-positive bacterial burden, indicated by elevated LTA level, and sustained systemic immune activation, indicated by increased suPAR level. The persistence of bacteria in chronic wounds is likely to induce prolonged TLR2-mediated inflammation (19), thereby increasing suPAR release, which contributes to endothelial dysfunction and impaired healing; in contrast, localized abscess, being more contained, elicit a less systemic and transient inflammatory response (20).
The elevated levels of LTA and suPAR in chronic wound infections compared with those in localized abscesses have important clinical implications, as they indicate more severe and persistent infection with systemic immune dysregulation. A high LTA level suggests a significant Gram-positive bacterial load that could be resistant to standard antibiotic therapy, highlighting the need for targeted antimicrobial strategies and potential biofilm disruption. Meanwhile, elevated suPAR levels indicate chronic inflammation and immune activation, which may contribute to poor wound healing, endothelial dysfunction, and increased risk of systemic complications, such as sepsis or organ injury. Monitoring of these biomarkers could help identify patients at risk for prolonged infections and guide therapeutic decisions (e.g., immunomodulatory treatments or advanced wound care). These biomarkers also serve as prognostic indicators for healing outcomes. Moreover, as suPAR is associated with tissue damage, interventions aimed at reducing systemic inflammation (e.g., anticytokine therapies) may improve recovery in patients with chronic wound.
The pathogen dispersion and resistance profiles showed that several bacterial species are becoming increasingly resistant to multiple drugs, which is concerning. S. aureus was identified as the most prevalent pathogen, accounting for 44.44% of the cases. Meanwhile, non-MDR was the predominant isolate, which was in significant disagreement with (21) that demonstrated of the 252 isolated coagulase-positive staphylococci (49.6%) were MDR, and 38 (15.1%) were XDR. Our analysis revealed that S. pneumoniae and S. anginous exhibited no MDR or XDR isolates, suggesting a comparatively lower resistance level in these species. These results are consistent with that of a research finding, which indicated that S. pneumoniae and S. anginosus showed no MDR or XDR isolates (21). Several bacterial species, including S. haemolyticus, E. faecium,and S. hominis, showed significant proportions of MDR and XDR strains, consistent with the results of previous studies (22), which reported that the prevalence rates of MDR were the highest for S. haemolyticus, S. epidermidis, S. hominis, E. Faecium, and S. aureus. The E. faecium resistance profile showed a considerable portion of XDR strains. This is consistent with the findings of a previous study (22), which indicated that E. faecium had the highest XDR prevalence rate among Gram-positive bacteria, with no XDR found in any other isolated Gram-positive species.
The present study showed that certain species (e.g., E. faecium) induced higher suPAR and LTA levels than the others, e.g., S. pneumoniae. E. faecium showed high LTA, an important part of the cell walls of Gram-positive bacteria. This may improves its capacity to activate TLR2-related inflammatory responses, possibly due to a thicker cell wall or increased LTA shedding (23). Furthermore, E. faecium is associated with a higher suPAR level, which suggests significant activation of the body’s immune system. This could be due to its capacity to trigger serious infections, such as endocarditis and BSIs, and avoid being cleared by the immune system, which results in ongoing inflammation. Notably, E. faecium is known for its significant antibiotic resistance, particularly to VRE, β-lactams, and aminoglycosides, which are frequently associated with acquired resistance genes, such as vanA and vanB, and adaptive mutations (24). This blend of improved immune support, ability to invade tissues, and resistance to multiple drugs highlights. The clinical danger posed by E. faecium arises from its ability to complicate treatment and induce ongoing inflammatory reactions in infected patients. The low LTA and suPAR levels in S. pneumoniae could reflect pathogen-specific biomarker patterns; however, the small sample size warrants caution. Larger studies are warranted to confirm these findings and reduce the impact of random variation.
However, the clinical reliability of these cutoff values could be affected by the heterogeneity observed in the biomarker levels between infections, as presented in Table 1. For example, the significant SD in the suPAR levels for E. faecium infections indicates that pathogen-specific variability could have an impact on the consistency of diagnostic thresholds. While the low standard errors in the ROC analysis (0.004 for suPAR and 0.005 for LTA) highlight the accuracy of these findings, as shown in Table 1, real-world application may require adjustments for parameters such as infection stage, host immune response, and comorbidities.
Area under the receiver operator characteristic (ROC) curve analysis revealed that a suPAR cutoff value of 145.140 ng/L can predict good prognosis for bacterial infection with high diagnostic accuracy of suPAR demonstrates 98.4% sensitivity and 93.3% specificity for predicting a good prognosis in bacterial infections, with an AUC of 99.6%. This suggests that suPAR is an excellent biomarker for distinguishing between severe and nonsevere bacterial infections. These findings are consistent with those of (25), which indicated that soluble suPAR at a cutoff value > 7.1 ng/mL had a high AUC of 0.96, with 95% CI (0.88–1.00), 96.2% sensitivity, and 96.2% specificity for the prediction of neonatal sepsis. Furthermore, the ROC curve analysis revealed that LTA demonstrates 95.161% sensitivity and 96.667% specificity for distinguishing between bacterial colonization and active infection at a cutoff value > 29.200 ng/mL, with an AUC of 99.409%, 95% CI (0.985–1.000). These findings are consistent with those of (26), which indicated that central venous catheters are colonized by Gram-positive organisms and facilitate biofilm formation. LTA can be quantified in the serum and plasma of hemodialysis patients with central venous catheters. However, its potential clinical utility in intraluminal biofilm characterization requires further investigation. In this study, the cultures demonstrated polymicrobial colonization. TCVCs exhibited the highest rate of increase in LTA during HD. The ROC curve demonstrated the prognostic significance of catheter aspirate LTA in predicting systemic LTA concentrations, with an AUC of 0.815 (95% CI, 0.68–0.95).
These findings possess several practical ramifications. The elevated accuracy of suPAR for LTA indicates its prospective application as a diagnostic or screening tool in clinical environments, particularly for high-risk patients (e.g., patient with sepsis). Second, therapeutic monitoring: Serial LTA assessments may assist in evaluating therapy efficacy, particularly in persistent infections. Third, research directions: Future investigations should associate LTA with microbial load and inflammatory indicators to enhance its therapeutic applicability.
This study has several limitations that need to be acknowledged—1) sample heterogeneity: variations in infection severity, bacterial load, and patient comorbidities (e.g., diabetes) may affect the LTA levels. 2) LTA specificity: although raised during infections, suPAR lacks pathogen specificity; therefore, it cannot distinguish between the types of infections without further diagnosis. 3) Limited sample size: The study may lack the statistical ability to identify nuanced variations among the infection groups. A restriction is the elevated LTA resulting from antibiotic therapy for wound infection.
CONCLUSION
This study highlights the potential of LTA and suPAR as indicators for the rapid detection of Gram-positive bacterial infections. The significant variations in blood levels observed between the infected patients and healthy controls indicated that this test group potentially enhances the diagnostic accuracy and informs treatment strategies. With the increasing threat of drug-resistant diseases, the development and implementation of novel testing methodologies, such as the LTA and suPAR panels, will be crucial for safeguarding public health and assisting patients.
