


INTRODUCTION
Proper handling of solid and medical waste is important for the protection of public health and ecological systems. For this reason, sanitary landfills and waste treatment facilities are built to contain refuse which may contain pathogenic organisms and mitigate environmental contamination. However, even with these engineered controls in place, the spread and persistence of pathogenic bacteria within landfills remains a concern. This is especially apparent in underdeveloped nations where policy execution and capacity to monitor is inconsistent.
The Calajunan Sanitary Landfill in Iloilo city, Philippines exemplifies this issue. Since 1986, it has served as Iloilo city’s disposal site for nearly three decades. During this time, it was considered as an open dumpsite taking in all kinds of waste types ranging from domestic refuse, industrial by-products, and untreated medical waste, although in 2015 it has transitioned to a sanitary landfill. Because of its long history as a disposal site, the prolonged deposition of heterogeneous waste creates ideal conditions that may facilitate the persistence and spread of antibiotic-resistant bacteria and resistance genes (ARGs) (1). Despite these, studies that look into landfill sediments as sources of antibiotic-resistant bacteria (ARB) and resistance genes (ARGs) are still limited, especially in the Philippine context.
Moreover, infrastructure deficiencies and poor waste segregation strategies can also promote the emergence and dissemination of antimicrobial resistance (AMR). In these conditions, bacteria are exposed to more selective pressures, their survivability is enhanced and horizontal gene transfer is fostered (2). National laws such as Republic Act 9003 has mandated the closure of open dumpsites and promoted their rehabilitation to sanitary landfills and even then, its implementation has faced logistical and infrastructural challenges. As a result, there are still concerns about the long-term ecological impact of past waste disposal practices.
Unlike landfill leachates which have been more studied, landfill sediments are often overlooked. They are ecologically rich habitats for microbes because of its capability to trap moisture, nutrients, and organic substrates, a favorable environment for microbes to thrive. Furthermore, resistant bacterial populations within these conditions are enabled to persist and interact, potentially enhancing gene exchange. With the scarcity of baseline local data, the contribution of landfill sediments to the persistence and spread resistance remains insufficiently defined.
Considering the transition of the Calajunan Sanitary Landfill from a former open dumpsite to its current controlled system, this study critically evaluated whether pathogenic and antibiotic-resistant bacteria persist within its sediments. It specifically investigated the occurrence, diversity, resistance profiles, and virulence-associated traits of recovered bacterial isolates, without addressing infrastructural compliance. The detection of clinically relevant and multidrug-resistant bacteria indicates sustained ecological impacts, possible operational constraints, and environmental conditions that favor microbial persistence. To our knowledge, this study represents the first comprehensive microbiological assessment of landfill sediments at Calajunan, and among the few in the Philippine context, providing essential baseline data on environmental antimicrobial resistance. By generating site-specific evidence, this work reinforces the role of landfill ecosystems as reservoirs of resistance in tropical developing regions and underscores their inclusion in surveillance strategies. Current findings are pivotal to global health priorities and support the United Nations Sustainable Development Goals, particularly SDG 6 (Clean Water and Sanitation) and SDG 15 (Life on Land).
MATERIALS AND METHODS
Study Site and Sample Collection
Sediment sampling was conducted at the Calajunan Sanitary Landfill located in Barangay Calajunan, Mandurriao, Iloilo City, Philippines. The 24-hectare facility, situated approximately 7 km from the city center, functioned as a disposal and treatment site for domestic, industrial, and medical wastes. Five distinct sampling stations were established to represent heterogeneous operational zones within the landfill (Fig. 1). Two replicate sediment samples were collected from each station during each sampling period to ensure adequate representation of site variability.
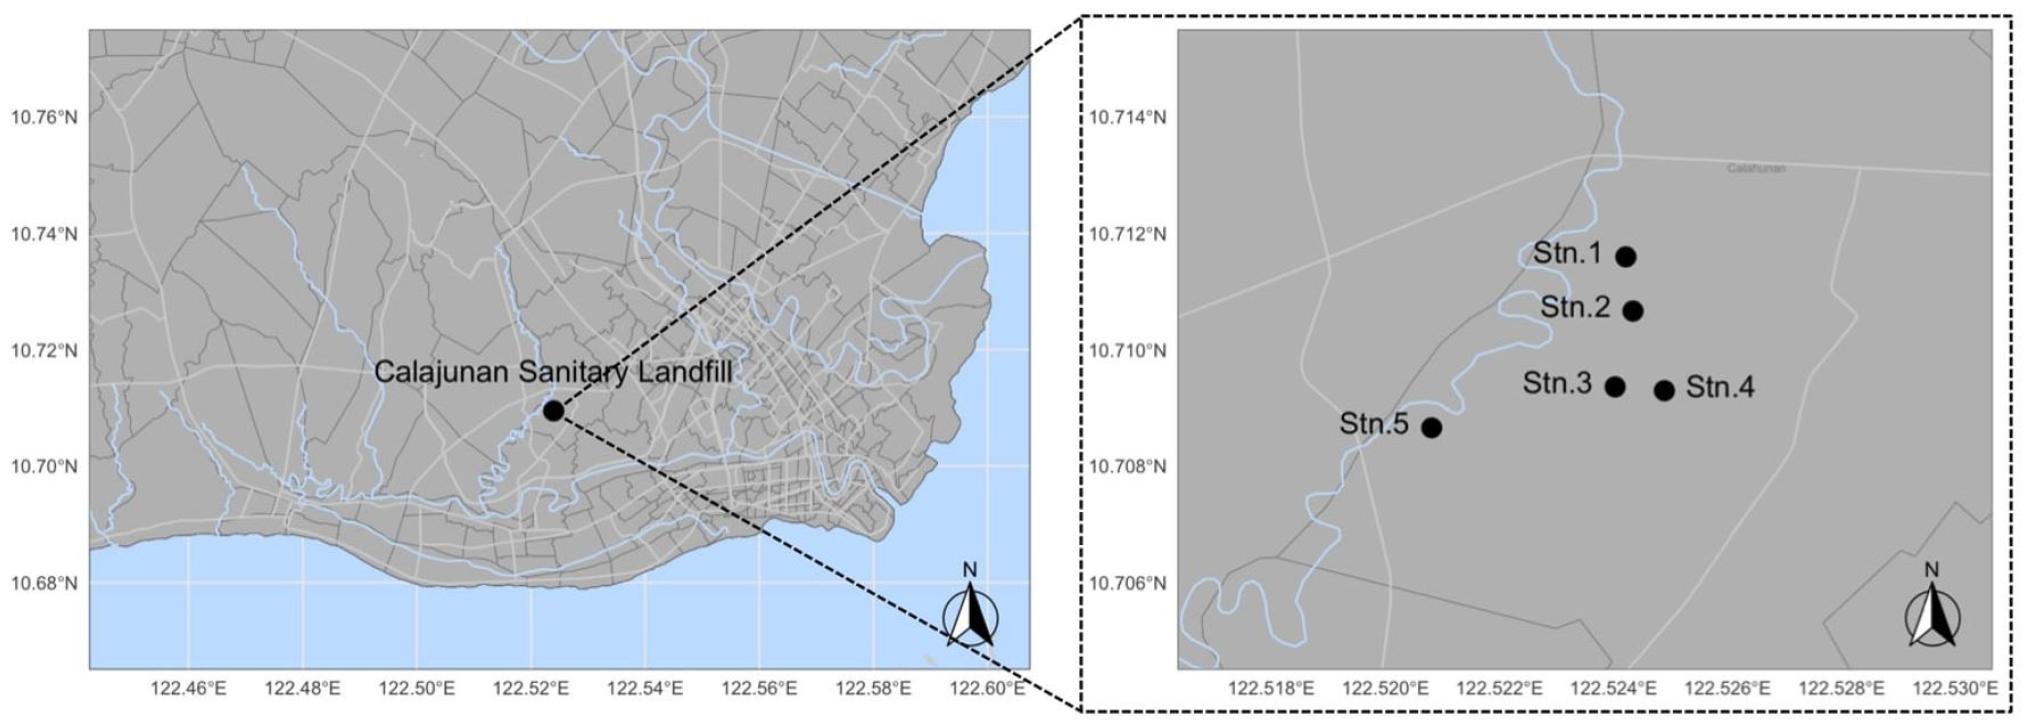
Fig. 1
Geographic location of the Calajunan Sanitary Landfill, Iloilo City, Philippines, and spatial distribution of the five designated sediment sampling stations (Stn. 1–Stn. 5) within the study area. The inset map shows the regional location of the landfill, while the enlarged panel illustrates the relative positions of the sampling stations.
Sampling Station 1 represented the organic waste composting area, Station 2 the medical waste disposal zone, Stations 3 and 4 the active landfill cells receiving mixed and unsorted waste, and Station 5 the leachate settling pond adjacent to the leachate treatment facility. The geographic coordinates, station descriptions, and corresponding waste categories for each sampling station are summarized in Table 1.
Table 1.
Characteristics of sampling stations, geographic coordinates, and waste categories at the Calajunan Sanitary Landfill, Iloilo City, Philippines
Sediment samples were collected between 08:00 and 10:00 A.M., with ambient air temperatures ranging from approximately 27–28 °C. Approximately 50 g of sediment were collected from each site at a depth of 5–6 cm using a sterile 50-mm sediment corer. Samples were transferred aseptically into labeled sterile polyethylene bags. Collections were conducted during two separate sampling periods (June and July 2025) to improve representativeness of site conditions while ensuring sampling consistency within the wet season. All samples were immediately placed in insulated containers with ice packs and transported to the Microbiology Laboratory of the College of Medical Laboratory Science, Central Philippine University for subsequent analyses.
Sediment Physicochemical Analyses
Before the composite sediment samples (n=2) were analyzed, they were first air-dried at room temperature, gently crushed using a wooden roller and sieved through a 2-mm mesh to remove unwanted materials such as stone, and plant matter. After homogenization, the samples were then thoroughly mixed and placed inside appropriately labelled plastic bags. A separate subsample for moisture determination was prepared and was placed inside an airtight container to prevent water loss before analysis.
Sediment physicochemical properties were analyzed at the Bureau of Soils and Water Management (BSWM) Regional Soil Laboratory, Department of Agriculture–Regional Field Office VI (Western Visayas), Fort San Pedro Drive, Iloilo City, Philippines. All analyses were performed under standardized laboratory conditions in accordance with the laboratory’s internal quality assurance procedures and the official analytical protocols of the BSWM, Department of Agriculture (3). The parameters determined included pH (potentiometric method) (4), organic carbon (%C; Walkley–Black dichromate oxidation) (5), total nitrogen (%N; Kjeldahl digestion and distillation) (6), potassium (%K2O; flame atomic emission spectroscopy) (7), phosphorus (%P2O5; vanadomolybdate colorimetry) (8), calcium (%CaO; titrimetric extraction) (9), and moisture content (gravimetric oven-drying) (10).
Bacteriological Analyses
Total Heterotrophic Plate Count (THPC)
The total heterotrophic plate count (THPC) was quantified by adding 1g of thoroughly homogenized sediment sample to 9 ml of 0.85% saline solution to achieve an initial 10⁻¹ dilution. Subsequent serial tenfold dilutions were prepared up to 10⁻⁵. After which, 0.1 mL aliquots from each dilution were spread plated onto Trypticase Soy Agar (TSA; Merck, Germany) and the plates were then incubated at 37°C for 24 hours. After incubation, the number of visible colonies was noted, and the bacterial load was expressed as colony-forming units per gram (CFU/g) of sediment.
Isolation, Characterization, and Identification of Cultivable Bacteria
Cultivable bacteria recovered from sediment samples were identified during each sampling period. To determine the dominant colonial morphotypes, colonies that had grown for 24 hours on TSA plates, originally prepared for THPC analysis, were described according to morphology, including shape, size, elevation, margin, pigmentation, and transparency. The relative frequency of each colony type was recorded to estimate the proportional composition of dominant bacteria in the samples.
Representative colonies, around five to ten per dominant type, were inoculated onto TSA plates and subjected to several rounds of purification. The purified isolates were then inoculated in Trypticase Soy Broth (TSB; Merck, Germany) supplemented with 15% glycerol and stored at –80°C for preservation and further analyses. Preliminary identification was carried out through Gram staining and motility assessment, followed by biochemical characterization, including tests for lactose, glucose, and sucrose fermentation, sulfide production, lysine decarboxylation and deamination, citrate utilization, and indole production (Supplementary Table 1), in accordance with the procedures outlined in Bergey’s Manual of Systematic Bacteriology (11).
Representative isolates from the predominant colony morphotypes were selected for species-level identification by 16S rRNA gene sequencing. Genomic DNA was extracted using the Wizard® Genomic DNA Purification Kit (Promega Corporation, Madison, WI, USA) according to the manufacturer’s instructions. Briefly, overnight bacterial cultures were centrifuged at 13,000–16,000 × g for 2 min to obtain cell pellets. Gram-positive isolates were pretreated with lysozyme (10 mg mL⁻¹), whereas Bacillus isolates were additionally treated with lysostaphin (10 mg mL⁻¹) prepared in 50 mM EDTA (pH 8.0) and incubated at 37°C for 30–60 min to facilitate cell wall digestion. Following cell lysis, RNase treatment, protein precipitation, isopropanol-mediated DNA precipitation, ethanol washing, and DNA rehydration were performed according to the manufacturer’s protocol. Purified genomic DNA was stored at 2–8°C until PCR amplification.
The nearly full-length 16S rRNA gene was amplified using the universal bacterial primers 27F (5′-AGAGTTTGATCCTGGCTCAG-3′) and 1492R (5′-TACGGYTACCTTGTTACGACTT-3′). PCR amplification was carried out in a 25-µL reaction mixture containing 5× Flexi Buffer, MgCl2, dNTPs, Taq DNA polymerase, forward and reverse primers, template DNA, and nuclease-free water. The amplification protocol consisted of an initial denaturation at 94°C, followed by 30 cycles of denaturation, primer annealing, and extension, with a final extension at 72°C. Amplified products were verified by agarose gel electrophoresis using a 1-kb DNA ladder.
Purified PCR amplicons were submitted to Macrogen Inc. (Seoul, South Korea) for bidirectional Sanger sequencing. The resulting sequences were quality-trimmed and compared against the National Center for Biotechnology Information (NCBI) GenBank nucleotide database using the Basic Local Alignment Search Tool (BLAST). Species-level identification was assigned based on sequence similarity and query coverage consistent with established 16S rRNA gene taxonomic criteria.
Virulence-Associated Enzymatic and Hemolytic Activities
Virulence-associated phenotypic characteristics, including DNase, gelatinase, and hemolytic activities, were assessed using standard microbiological methods (11). Hemolytic activity was determined on blood agar, DNase production on DNase agar following the addition of 1 M hydrochloric acid, and gelatinase activity by assessing gelatin liquefaction after refrigeration. Escherichia coli ATCC 25922 and Staphylococcus aureus ATCC 25923 were included as reference strains for quality control.
Antimicrobial Resistance Profiling
Antimicrobial susceptibility was assessed using the Kirby–Bauer disk diffusion technique. Bacterial suspensions were prepared in sterile saline solution. The turbidity of the bacterial suspension was subsequently adjusted to correspond to the 0.5 McFarland standard. The standardized inocula were then uniformly spread onto Mueller–Hinton agar (MHA; Merck, Germany) plates using procedures adapted from the guidelines of the Clinical and Laboratory Standards Institute (12).
The antibiotic panel included amoxicillin (25 µg), chloramphenicol (30 µg), doxycycline (30 µg), erythromycin (15 µg), enrofloxacin (5 µg), neomycin (30 µg), nitrofurantoin (300 µg), norfloxacin (10 µg), oxytetracycline (30 µg), and trimethoprim–sulfamethoxazole (25 µg). These antibiotics represent multiple antimicrobial classes that are widely used in human medicine, veterinary practice, and food-animal and aquaculture production, thereby providing a broad assessment of antimicrobial resistance among environmental bacterial isolates (13, 14). Plates were incubated at 37°C for 18–24 hours. Zones of inhibition were measured in millimeters using a caliper and interpreted according CLSI criteria (12). E. coli ATCC 25922 and S. aureus ATCC 25923 served as quality control reference strains.
The Multiple Antibiotic Resistance (MAR) index was calculated using the formula: MAR = a / b , where a represented the number of antibiotics to which the isolate exhibited resistance and b corresponded to the total number of antibiotics tested (15). It should be noted that antimicrobial agents for which bacterial species possess intrinsic resistance, as defined by the European Committee on Antimicrobial Susceptibility Testing (EUCAST) expected resistant phenotypes (16), were excluded from the calculation of multiple antibiotic resistance (MAR) indices.
Statistical Analysis
All experiments were conducted in triplicate to ensure reproducibility. Bacterial counts (CFU/g) were log10-transformed prior to analysis and presented as mean ± standard deviation. Differences in heterotrophic plate counts among sampling stations were evaluated using one-way analysis of variance (ANOVA), followed by Tukey’s post hoc test for multiple comparisons. Statistical significance was set at p < 0.05. Additionally, Spearman’s rank correlation analysis was used to evaluate the relationships between sediment physicochemical parameters and bacterial community composition across the sampling stations. This was performed using the Hmisc package (v5.1) in the R statistical software environment (version 4.5.3; 2026-03-11).
RESULTS
Physicochemical Properties of Sediment Samples Across Sampling Stations
The physicochemical characteristics of sediment samples collected from the five sampling stations are presented in Table 2. Significant differences (p < 0.05) were observed among stations for all measured parameters. Sediment pH ranged from moderately to strongly alkaline (7.92 ± 0.02 – 8.45 ± 0.05), with Stations 3, 4, and 5 (8.35 ± 0.05 – 8.45 ± 0.05) exhibiting significantly higher pH values than Stations 1 and 2 (7.92 ± 0.02 – 7.93 ± 0.05). The highest mean pH values were recorded in Stations 4 and 5.
Table 2.
Physicochemical characteristics of sediment samples collected from five sampling stations at the Calajunan Sanitary Landfill, Iloilo City, Philippines. Values are presented as mean ± standard deviation (SD) based on two independent sampling events. Within each parameter, means sharing the same superscript letter are not significantly different among sampling stations (p < 0.05)
Total organic carbon (TOC) varied markedly across stations, with Station 1 (13.48 ± 0.07%) exhibiting significantly higher TOC levels than all other stations, whereas Stations 4 (1.29 ± 0.01%) and 5 (1.40 ± 0.01%) showed the lowest values. A similar trend was observed for total nitrogen, where Station 1 (2.06 ± 0.04%) recorded the highest concentrations while Stations 3, 4, and 5 (0.16 ± 0.01%) had significantly lower levels. Total potassium content also differed significantly among stations, with Station 1 (0.95 ± 0.05%) showing the highest concentration, followed by Station 5 (0.51 ± 0.02%), whereas Stations 2, 3, and 4 exhibited comparatively lower values (0.16 ± 0.01 - 0.24 ± 0.01%).
Phosphorus and calcium concentrations followed similar spatial patterns, with Station 1 (1.66 ± 0.05%) consistently recording the highest phosphorous level, while Station 5 (1.36 ± 0.05%) exhibited the lowest calcium concentration. Moisture content also varied significantly, with Stations 1 (41.58 ± 0.07%) and 5 (41.92 ± 0.11%) showing higher values compared with Stations 2 (38.14 ± 0.25%), 3 (33.40 ± 0.35%), and 4 (27.36 ± 0.06%); the lowest moisture content was observed in Station 4. By and large, sediments from Station 1 were characterized by elevated nutrient and organic matter content, whereas Stations 3 and 4, representing active landfill zones, exhibited lower nutrient levels but higher alkalinity.
Total Heterotrophic Plate Counts (THPC) in Landfill Sediments
Fig. 2 presents the THPC of sediment samples collected from the five sampling stations during June and July. Results are expressed as mean ± SD in log10 CFU/g based on duplicate sub-stations (n = 2). In June, THPC values ranged from 7.05 ± 0.01 to 7.81 ± 0.20 log10 CFU/g. Station 1 exhibited the highest bacterial load and differed significantly from most stations (p < 0.05). Stations 4 and 5 recorded the lowest counts and were not significantly different from each other, whereas Station 3 showed intermediate values comparable to Stations 2 and 4. In July, THPC values ranged from 7.10 ± 0.03 to 7.89 ± 0.04 log10 CFU/g. Station 1 again recorded the highest bacterial count and remained significantly different from all other stations (p < 0.05). Greater spatial differentiation among stations was observed during July, with significant differences detected across most sampling areas.
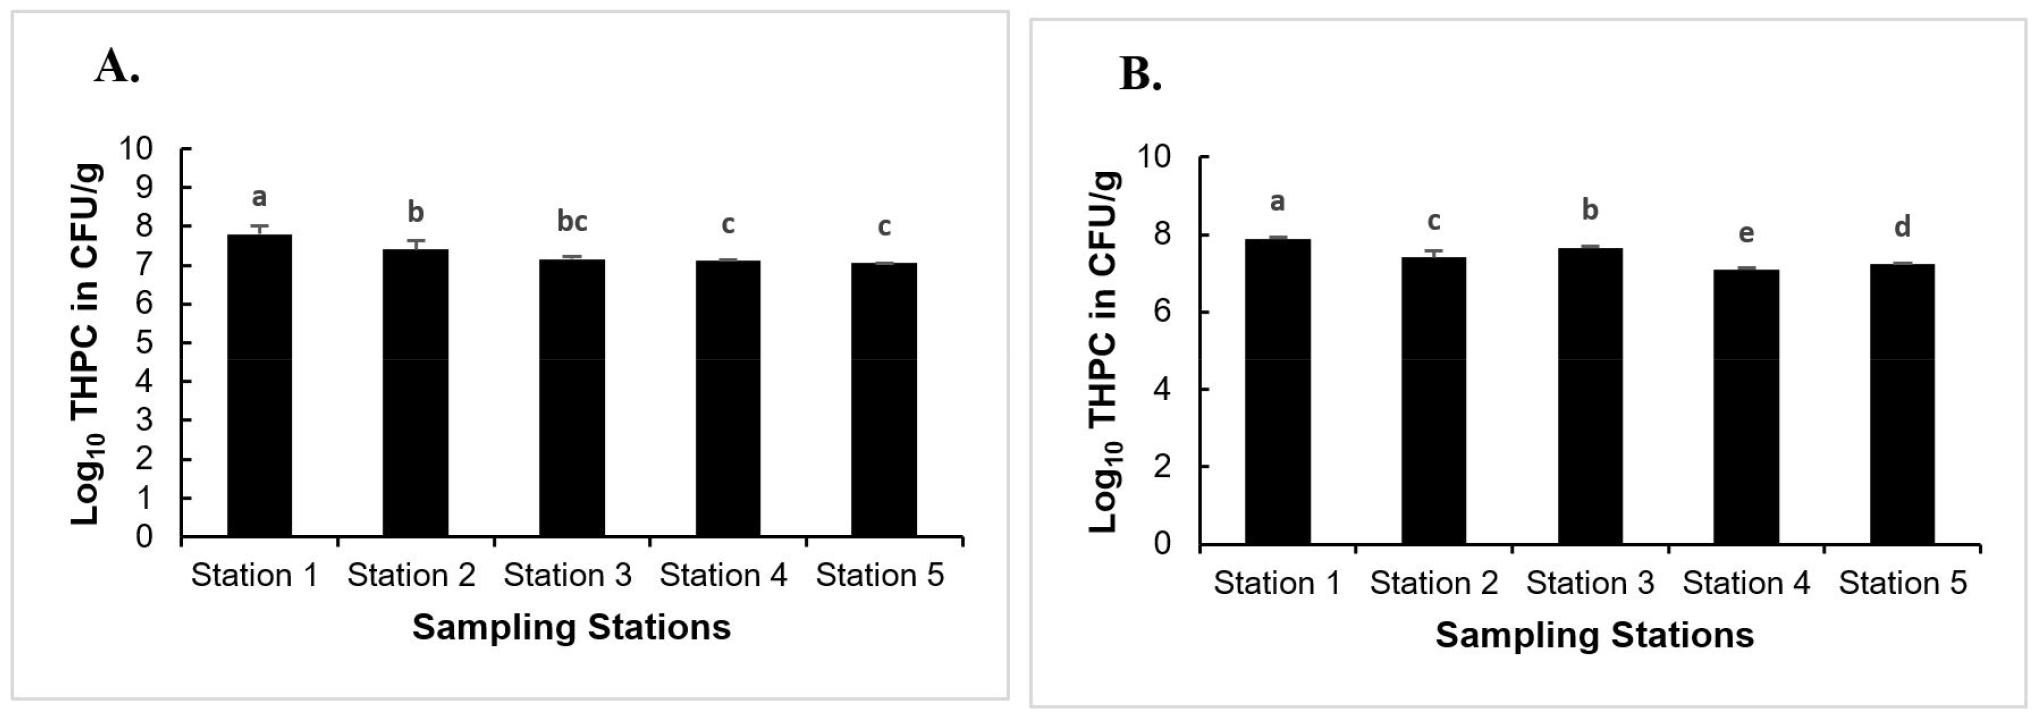
Fig. 2
Total heterotrophic plate counts (THPC) in sediment samples from five sampling stations at the Calajunan Sanitary Landfill during June (A) and July (B). Data are presented as mean ± SD (log10 CFU/g; n = 2), based on duplicate sub-stations per sampling station. Different superscript letters indicate significant differences among stations within each sampling period (p < 0.05).
Taxonomic Identification and Relative Abundance of Cultivable Bacterial Isolates
The taxonomic composition and relative abundance of bacterial isolates recovered from the five sampling stations are illustrated in Table 3, whereas their colonial morphology, Gram reaction, and biochemical characteristics are presented in Supplementary Table 1.
Table 3.
Taxonomic distribution and relative abundance of bacterial isolates recovered from sediment samples collected at five sampling stations within the Calajunan Sanitary Landfill, Iloilo City, Philippines. Data are presented as number (No.) and percentage (%) of isolates per station and overall. Station 1 represents the organic waste disposal area; Station 2 the medical waste disposal area; Stations 3 and 4 the inorganic and mixed waste areas; and Station 5 the leachate-impacted area. Gram reaction is indicated as positive (+) or negative (−)
A total of 489 bacterial isolates were recovered from the five sampling stations, with Station 5 yielding the highest number of isolates, followed by Stations 1, 2, 4, and 3. Gram-positive Bacillus spp. (51.3%) predominated across all stations, particularly Bacillus subtilis (14%) and B. proteolyticus (13%), which were most abundant in Stations 3 and 5, respectively. Other Bacillus taxa, including B. paramycoides (7%), B. velezensis (7%), and B. cereus (5%), occurred at lower frequencies across multiple stations.
Gram-negative isolates exhibited greater taxonomic diversity and comprised members of the genera Aeromonas, Citrobacter, Enterobacter, Klebsiella, Kosakonia, Morganella, Proteus, Providencia, and Pseudomonas. Morganella morganii (6%) was predominantly associated with the leachate-impacted area (Station 5), whereas K. cowanii (5%) and Citrobacter spp. were more evenly distributed among sampling stations. Aeromonas spp. were recovered from all sites but were comparatively more abundant in Stations 2 and 3.
Phenotypic characterization revealed distinct differences between Gram-positive and Gram-negative isolates. Gram-negative bacteria generally produced smooth, circular, convex, moist, and non-pigmented colonies, whereas Gram-positive Bacillus spp. formed larger colonies with dry to wrinkled surfaces and irregular or filamentous margins. Biochemical reactions were consistent with the observed taxonomic groupings. Most Enterobacteriaceae fermented glucose but differed in sucrose fermentation and hydrogen sulfide production. P. mirabilis exhibited characteristic swarming motility and hydrogen sulfide production, whereas K. pneumoniae produced large mucoid colonies and fermented all sugars in triple sugar iron medium. In contrast, Pseudomonas spp. were non-fermentative and tested positive for citrate utilization and motility. Additional reactions in lysine iron agar and sulfide-indole-motility media further differentiated isolates based on lysine decarboxylation, lysine deamination, indole production, hydrogen sulfide production, and motility.
Representative isolates corresponding to the dominant phenotypic groups were selected for 16S rRNA gene sequencing to confirm species identity (Supplementary Table 2). Amplified gene fragments ranged from 754 to 1,425 bp and yielded high-quality sequences with BLAST similarities ranging from 99.63% to 100% against reference sequences in the NCBI GenBank database. Most isolates exhibited ≥99% sequence identity, supporting reliable species-level identification.
Among Gram-negative isolates, sequencing confirmed the presence of several Aeromonas spp., including A. caviae (2%), A. hydrophila (3%), A. hydrophila subsp. ranae (1%), A. sanarellii (3%), and A. taiwanensis (2%). These taxa were predominantly recovered from medical waste- and leachate-impacted stations. Sequencing also confirmed Gram-positive isolates as members of the genus Bacillus, including B. cereus (5%), B. mycoides (1%), B. paramycoides (7%), B. proteolyticus (13%), B. stercoris (2%), and B. subtilis (14%). Notably, B. subtilis and B. proteolyticus were consistently recovered from multiple sampling stations and represented the dominant Gram-positive taxa.
Relationships between sediment physicochemical properties and dominant bacterial taxa
Fig. 3 presents the Spearman’s rank correlation coefficients (ρ) between sediment physicochemical characteristics and the dominant bacterial taxa. Generally, species-specific relationships were observed, with both positive and negative associations across the measured environmental variables. Most correlations were weak to moderate in magnitude, and only a limited number reached statistical significance (p < 0.05). Among the measured physicochemical parameters, organic carbon (%OC) and total nitrogen (%N) exhibited the greatest number of significant associations with bacterial taxa. B. velezensis showed significant positive correlations with both %OC and %N, whereas E. hormaechei was significantly negatively correlated with these parameters. A. hydrophila subsp. ranae also exhibited a significant negative association with %N. Significant correlations were likewise observed between C. europaeus and pH, B. cereus and %CaO, C. sedlakii and %CaO, M. morganii and %CaO, and P. tohonis and %N. In contrast, no statistically significant correlations were detected between bacterial taxa and potassium (%K2O), phosphorus (%P2O5), or moisture content.
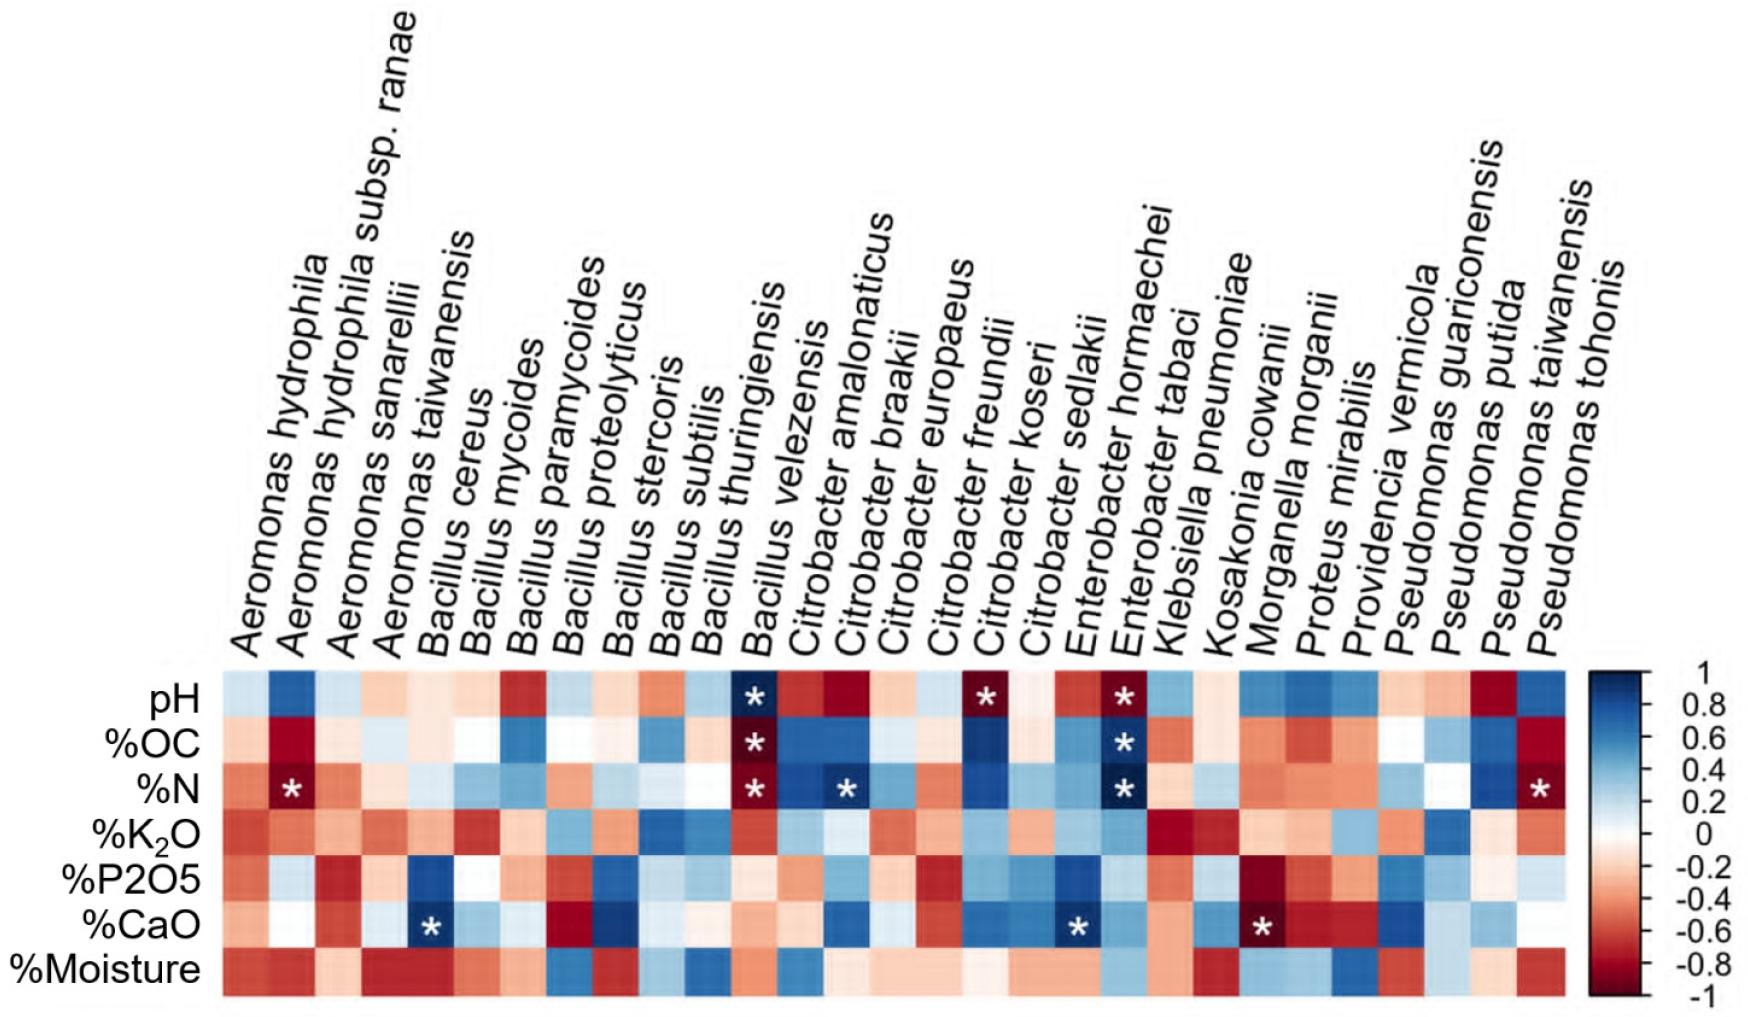
Fig. 3
Heatmap of Spearman’s rank correlation coefficients (ρ) illustrating the relationships between sediment physicochemical parameters and dominant bacterial taxa based in sediment samples collected from the five sampling stations at the Calajunan Sanitary Landfill. The color gradient ranges from deep blue (strong positive correlation) to deep red (strong negative correlation), with white representing weak or no correlation. Asterisks (*) indicate statistically significant correlations (p < 0.05).
Virulence-Associated Enzymatic and Hemolytic Activities
The virulence-associated enzymatic and hemolytic activities of the recovered bacterial isolates are summarized in Supplementary Table 3. Aeromonas spp. consistently exhibited DNase and gelatinase production, with most isolates also demonstrating hemolytic activity, indicating a broad repertoire of virulence-associated phenotypes. In contrast, Bacillus spp. displayed variable enzymatic profiles, although hemolytic and gelatinase activities were frequently observed, particularly among B. cereus, B. mycoides, B. paramycoides, B. subtilis, and B. proteolyticus. Members of the family Enterobacteriaceae and Pseudomonas spp. were generally negative for DNase, gelatinase, and hemolytic activities. Overall, Aeromonas spp. exhibited the greatest diversity of virulence-associated phenotypic traits among the bacterial groups examined.
Prevalence and Distribution of Antimicrobial Resistance Among Recovered Isolates
Table 4 summarizes the antimicrobial susceptibility profiles of the 489 bacterial isolates recovered from Calajunan Sanitary Landfill sediments. Overall, resistance was most frequently observed against amoxicillin, erythromycin, and neomycin, with numerous bacterial taxa exhibiting complete or near-complete resistance to these antimicrobial agents. Among Gram-positive isolates, Bacillus spp. consistently demonstrated high resistance to neomycin (99–100%) and amoxicillin (44–100%), while resistance to trimethoprim–sulfamethoxazole was also common in several species, including B. cereus (91%), B. mycoides (100%), B. paramycoides (100%), B. proteolyticus (100%), and B. thuringiensis (100%). Variable resistance to oxytetracycline was likewise observed among Bacillus species (11–100%), whereas resistance to chloramphenicol, norfloxacin, enrofloxacin, and doxycycline was generally low or absent.
Table 4.
Antimicrobial susceptibility patterns of bacterial isolates recovered from sediment samples at the Calajunan Sanitary Landfill, Iloilo City, Philippines, expressed as percentage (%) of isolates resistant to each antimicrobial agent
| Bacteria |
No of isolates examined | Gram Reaction | Percentage (%) of resistant isolates | |||||||||||||||||||
|---|---|---|---|---|---|---|---|---|---|---|---|---|---|---|---|---|---|---|---|---|---|---|
| B-lactam | Phenicol | Macrolide | Aminoglycoside | Nitrofurans | Fluoroquinolones | Tetracyclines | Sulfonamide | |||||||||||||||
| AMX | C | E | NE | NIT | NOR | ENR | OT | DO | SXT | |||||||||||||
| Bacillus cereus | 23 | + | 100 | 0 | 0 | 100 | 0 | 0 | 0 | 52 | 0 | 91 | ||||||||||
| Bacillus mycoides | 3 | + | 100 | 0 | 0 | 100 | 100 | 0 | 0 | 100 | 100 | 100 | ||||||||||
| Bacillus paramycoides | 34 | + | 100 | 0 | 100 | 100 | 0 | 0 | 0 | 0 | 0 | 100 | ||||||||||
| Bacillus proteolyticus | 62 | + | 100 | 11 | 60 | 100 | 73 | 0 | 37 | 60 | 32 | 100 | ||||||||||
| Bacillus stercoris | 8 | + | 0 | 0 | 0 | 100 | 0 | 0 | 0 | 100 | 0 | 0 | ||||||||||
| Bacillus subtilis | 68 | + | 44 | 0 | 12 | 99 | 13 | 0 | 0 | 100 | 0 | 44 | ||||||||||
| Bacillus thuringiensis | 18 | + | 100 | 0 | 39 | 100 | 61 | 0 | 0 | 11 | 0 | 100 | ||||||||||
| Bacillus velezensis | 35 | + | 0 | 0 | 0 | 100 | 0 | 0 | 0 | 100 | 0 | 0 | ||||||||||
| Aeromonas caviae | 10 | − | 100† | 0 | 100† | 100 | 0 | 0 | 0 | 20 | 0 | 80 | ||||||||||
| Aeromonas hydrophila | 13 | − | 54† | 0 | 85† | 85 | 0 | 0 | 0 | 0 | 0 | 0 | ||||||||||
| Aeromonas hydrophila subsp. ranae | 3 | − | 100† | 100 | 100† | 100 | 0 | 0 | 0 | 100 | 0 | 100 | ||||||||||
| Aeromonas sanarellii | 13 | − | 100† | 0 | 100† | 100 | 0 | 0 | 0 | 15 | 0 | 15 | ||||||||||
| Aeromonas taiwanensis | 10 | − | 100† | 0 | 100† | 100 | 40 | 0 | 60 | 60 | 40 | 80 | ||||||||||
| Citrobacter amalonaticus | 5 | − | 60† | 0 | 100† | 100 | 100 | 0 | 0 | 60 | 0 | 0 | ||||||||||
| Citrobacter braakii | 17 | − | 88† | 6 | 100† | 100 | 18 | 0 | 24 | 88 | 0 | 0 | ||||||||||
| Citrobacter europaeus | 5 | − | 100† | 60 | 100† | 100 | 100 | 0 | 100 | 100 | 60 | 0 | ||||||||||
| Citrobacter freundii | 16 | − | 75† | 25 | 100† | 100 | 0 | 0 | 6 | 75 | 0 | 0 | ||||||||||
| Citrobacter koseri | 10 | − | 100† | 30 | 100† | 100 | 100 | 0 | 0 | 60 | 0 | 0 | ||||||||||
| Citrobacter sedlakii | 20 | − | 100† | 0 | 100† | 100 | 100 | 0 | 0 | 100 | 0 | 0 | ||||||||||
| Enterobacter hormaechei | 15 | − | 80† | 20 | 100† | 100 | 100 | 0 | 20 | 80 | 20 | 0 | ||||||||||
| Enterobacter tabaci | 3 | − | 100† | 0 | 100† | 100 | 100 | 0 | 0 | 100 | 0 | 0 | ||||||||||
| Klebsiella pneumoniae | 5 | − | 100† | 0 | 100† | 100 | 100 | 0 | 0 | 100 | 0 | 0 | ||||||||||
| Kosakonia cowanii | 23 | − | 100† | 0 | 100† | 100 | 100 | 0 | 0 | 0 | 0 | 0 | ||||||||||
| Morganella morganii | 28 | − | 96† | 89 | 100† | 100 | 100† | 0 | 0 | 82 | 0 | 0 | ||||||||||
| Proteus mirabilis | 8 | − | 0 | 38 | 100† | 100 | 100† | 0 | 0 | 100† | 100† | 38 | ||||||||||
| Providencia vermicola | 5 | − | 100† | 100 | 100† | 100 | 100† | 0 | 0 | 100 | 100 | 0 | ||||||||||
| Pseudomonas guariconensis | 15 | − | 100† | 100 | 100† | 100† | 100† | 0 | 100 | 100† | 87† | 100† | ||||||||||
| Pseudomonas putida | 3 | − | 100† | 100 | 100† | 100† | 100† | 0 | 100 | 100† | 0 | 100† | ||||||||||
| Pseudomonas taiwanensis | 8 | − | 63† | 63 | 100† | 100† | 100† | 0 | 38 | 63† | 0 | 63† | ||||||||||
| Pseudomonas tohonis | 3 | − | 100† | 100 | 100† | 100† | 100† | 0 | 0 | 0 | 0 | 100† | ||||||||||
Among Gram-negative isolates, resistance to amoxicillin (54–100%), erythromycin (85–100%), and neomycin (85–100%) was widespread. Elevated resistance to nitrofurantoin (100%) and oxytetracycline (63–100%) was likewise observed in several members of the genera Citrobacter, Enterobacter, Klebsiella, Morganella, Proteus, Providencia, and Pseudomonas. In contrast, resistance to norfloxacin was absent in all bacterial taxa examined (0%), whereas resistance to enrofloxacin and doxycycline remained relatively infrequent and was confined to selected species.
Taken together, the highest frequencies of resistance among the bacterial taxa were observed for neomycin (100% of taxa), amoxicillin (90.0% of taxa), erythromycin (86.7% of taxa), and oxytetracycline (86.7% of taxa), followed by nitrofurantoin (70.0% of taxa) and trimethoprim–sulfamethoxazole (50.0% of taxa). Resistance values marked with a dagger (†) denote intrinsic resistance according to the EUCAST expected resistant phenotypes and were excluded from the computation of multiple antibiotic resistance (MAR) indices.
Distribution of Multiple Antibiotic Resistance (MAR) Index Values Among Bacterial Isolates
The distribution of multiple antibiotic resistance (MAR) index values among the bacterial isolates is presented in Table 5. MAR indices were calculated using only acquired resistance phenotypes, with antimicrobial agents to which bacterial species exhibit intrinsic resistance excluded from the analysis according to EUCAST expected phenotypes (16). Overall, Gram-positive Bacillus spp. predominantly exhibited MAR indices of 0.4, including Bacillus cereus (52.2%), B. paramycoides (100%), B. subtilis (51.5%), and B. thuringiensis (94.4%), whereas B. mycoides showed a MAR index of 0.6 (100%). Among Gram-negative isolates, MAR index values were more variable across species. High MAR index values were observed in P. guariconensis (0.7; 100%), P. putida (0.7; 100%), P. vermicola (0.6; 100%), M. morganii (0.4; 71.4%), C. europaeus (0.8; 60.0%), and A. taiwanensis (0.8; 40.0%). Conversely, all isolates of K. cowanii and P. tohonis exhibited a MAR index of 0.3, while 84.6% of Aeromonas hydrophila and Aeromonas sanarellii isolates exhibited a MAR index of 0.1. Notably, isolates with MAR indices ≥0.2 predominated in most bacterial species, indicating widespread occurrence of bacteria originating from environments subjected to substantial antimicrobial selective pressure.
Table 5.
Distribution of multiple antibiotic resistance (MAR) index values among bacterial isolates recovered from sediment samples collected at five sampling stations of the Calajunan Sanitary Landfill, Iloilo City, Philippines. MAR indices were calculated after excluding antimicrobial agents to which bacterial species exhibit intrinsic resistance according to EUCAST expected phenotypes
| Bacteria |
No of Isolates Examined | Gram Reaction | % of Isolates per MAR Index1 | ||||||||
|---|---|---|---|---|---|---|---|---|---|---|---|
| MAR Index | |||||||||||
| 0 | 0.1 | 0.2 | 0.3 | 0.4 | 0.5 | 0.6 | 0.7 | 0.8 | |||
| Bacillus cereus | 23 | + | 0 | 0 | 8.7 | 39.1 | 52.2 | 0 | 0 | 0 | 0 |
| Bacillus mycoides | 3 | + | 0 | 0 | 0 | 0 | 0 | 0 | 100 | 0 | 0 |
| Bacillus paramycoides | 34 | + | 0 | 0 | 0 | 0 | 100 | 0 | 0 | 0 | 0 |
| Bacillus proteolyticus | 62 | + | 0 | 0 | 0 | 0 | 33.9 | 21.0 | 6.5 | 16.1 | 22.6 |
| Bacillus stercoris | 8 | + | 0 | 0 | 100 | 0 | 0 | 0 | 0 | 0 | 0 |
| Bacillus subtilis | 68 | + | 0 | 1.5 | 36.8 | 10.3 | 51.5 | 0 | 0 | 0 | 0 |
| Bacillus thuringiensis | 18 | + | 0 | 0 | 0 | 0 | 94.4 | 5.6 | 0 | 0 | 0 |
| Bacillus velezensis | 35 | + | 0 | 0 | 100 | 0 | 0 | 0 | 0 | 0 | 0 |
| Aeromonas caviae | 10 | − | 0 | 20 | 0 | 60 | 20 | 0 | 0 | 0 | 0 |
| Aeromonas hydrophila | 13 | − | 15.4 | 84.6 | 0 | 0 | 0 | 0 | 0 | 0 | 0 |
| Aeromonas hydrophila subsp. ranae | 3 | − | 0 | 0 | 0 | 0 | 100 | 0 | 0 | 0 | 0 |
| Aeromonas sanarellii | 13 | − | 0 | 84.6 | 0 | 0 | 15.4 | 0 | 0 | 0 | 0 |
| Aeromonas taiwanensis | 10 | − | 0 | 20 | 0 | 20 | 0 | 20 | 0 | 0 | 40 |
| Citrobacter amalonaticus | 5 | − | 0 | 0 | 0 | 40 | 60 | 0 | 0 | 0 | 0 |
| Citrobacter braakii | 17 | − | 0 | 0 | 11.8 | 58.8 | 11.8 | 17.6 | 0 | 0 | 0 |
| Citrobacter europaeus | 5 | − | 0 | 0 | 0 | 0 | 0 | 40 | 0 | 0 | 60 |
| Citrobacter freundii | 16 | − | 0 | 25.0 | 0 | 43.8 | 31.2 | 0 | 0 | 0 | 0 |
| Citrobacter koseri | 10 | − | 0 | 0 | 0 | 40.0 | 30 | 30 | 0 | 0 | 0 |
| Citrobacter sedlakii | 20 | − | 0 | 0 | 0 | 0 | 100 | 0 | 0 | 0 | 0 |
| Enterobacter hormaechei | 15 | − | 0 | 0 | 0 | 20 | 40 | 20 | 20 | 0 | 0 |
| Enterobacter tabaci | 3 | − | 0 | 0 | 0 | 0 | 100 | 0 | 0 | 0 | 0 |
| Klebsiella pneumoniae | 5 | − | 0 | 0 | 0 | 0 | 100 | 0 | 0 | 0 | 0 |
| Kosakonia cowanii | 23 | − | 0 | 0 | 0 | 100 | 0 | 0 | 0 | 0 | 0 |
| Morganella morganii | 28 | − | 0 | 0 | 0 | 28.6 | 71.4 | 0 | 0 | 0 | 0 |
| Proteus mirabilis | 8 | − | 0 | 0 | 62.5 | 0 | 0 | 37.5 | 0 | 0 | 0 |
| Providencia vermicola | 5 | − | 0 | 0 | 0 | 0 | 0 | 0 | 100 | 0 | 0 |
| Pseudomonas guariconensis | 15 | − | 0 | 0 | 0 | 0 | 0 | 0 | 0 | 100 | 0 |
| Pseudomonas putida | 3 | − | 0 | 0 | 0 | 0 | 0 | 0 | 0 | 100 | 0 |
| Pseudomonas taiwanensis | 8 | − | 37.5 | 0 | 0 | 25 | 0 | 0 | 0 | 37.5 | 0 |
| Pseudomonas tohonis | 3 | − | 0 | 0 | 0 | 100 | 0 | 0 | 0 | 0 | 0 |
1Percentages were calculated based on the total number of isolates examined per bacterial species. MAR indices exclude antibiotics for which bacterial species are intrinsically resistant according to EUCAST expected phenotypes. A MAR index of zero indicates susceptibility to all antibiotics included in the MAR calculation.
DISCUSSION
This study provides a baseline characterization of the cultivable bacterial community inhabiting sediments from the Calajunan Sanitary Landfill, Iloilo City, together with their virulence-associated phenotypes, antimicrobial resistance profiles, and relationships with sediment physicochemical characteristics. To our knowledge, this is the first report from Western Visayas and among the few studies in the Philippines integrating sediment physicochemical characterization with culture-based bacterial identification, virulence-associated phenotypic assessment, antimicrobial susceptibility testing, multiple antibiotic resistance (MAR) index analysis, and correlation analysis. Although the present investigation was not designed to elucidate the molecular mechanisms underlying bacterial persistence or antimicrobial resistance, it establishes a valuable reference dataset for future ecological monitoring and environmental antimicrobial resistance (AMR) surveillance in Philippine landfill ecosystems.
The marked spatial variation in sediment physicochemical properties among the sampling stations was accompanied by corresponding differences in bacterial abundance and community composition, indicating that local environmental conditions influence the distribution of cultivable bacteria. Stations enriched in organic carbon and total nitrogen supported higher heterotrophic bacterial counts and yielded a greater diversity of cultivable isolates than stations with lower nutrient availability. These observations are consistent with previous studies identifying organic matter as a major determinant of bacterial growth because it provides carbon and energy sources that sustain microbial metabolism (17, 18, 19). Organic carbon and nitrogen are particularly important in landfill environments (20), where continuous decomposition of organic waste generates heterogeneous nutrient-rich microhabitats that selectively favor bacteria capable of efficiently utilizing available substrates (21). The observed association between elevated nutrient content and increased cultivable bacterial abundance further emphasizes the importance of organic matter availability in structuring landfill microbial communities, although additional environmental factors undoubtedly contribute to community composition.
Correlation analysis further demonstrated that the influence of sediment chemistry was species-specific rather than uniform across the bacterial community. Organic carbon and total nitrogen exhibited the greatest number of significant associations with the recovered taxa, whereas pH and calcium also influenced the occurrence of selected bacterial species. In contrast, potassium, phosphorus, and moisture content showed comparatively weaker relationships with bacterial distribution under the conditions examined. Because most correlations were weak to moderate, these findings should be interpreted as ecological associations rather than evidence of direct causal relationships. The distribution of bacteria within landfill sediments is likely governed by multiple interacting factors, including nutrient availability, waste composition, physicochemical heterogeneity, microbial competition, and other environmental variables (21, 22, 23) that were beyond the scope of the present study. Nevertheless, the observed associations suggest that sediment chemistry contributes to shaping the cultivable bacterial community and provides a useful framework for future hypothesis-driven investigations. The absence of strong universal correlations further supports the concept that bacterial community assembly in landfill sediments is governed by multiple interacting environmental and biological processes rather than by any single physicochemical factor (24).
The predominance of Bacillus spp. across the sampling stations agrees with their well-recognized ecological versatility and capacity to survive fluctuating environmental conditions through endospore formation (25). This adaptive strategy enables members of the genus to persist under changing nutrient availability, moisture, and pH conditions that characterize landfill environments. Similar predominance of Bacillus species has been reported in landfill soils and other waste-impacted terrestrial environments (26, 27), suggesting that these organisms represent an important component of cultivable bacterial communities associated with organic-rich ecosystems. Beyond their ability to form endospores, Bacillus species contribute to organic matter decomposition and nutrient recycling, thereby playing important ecological roles in waste-associated environments (28, 29). Alongside Bacillus spp., the recovery of opportunistic Gram-negative genera including Aeromonas, Citrobacter, Enterobacter, Klebsiella, Morganella, Proteus, Providencia, and Pseudomonas reflects the ecological heterogeneity of landfill sediments, where municipal, domestic, agricultural, and healthcare wastes create diverse physicochemical niches capable of supporting bacteria with different ecological strategies (23, 30). Many members of the family Enterobacteriaceae are commonly associated with the gastrointestinal microbiota of humans and animals (31), suggesting that mixed municipal wastes likely contribute to the bacterial assemblages recovered from the landfill sediments. Although the presence of these organisms does not demonstrate environmental transmission or pathogenicity, it indicates that landfill sediments can function as environmental reservoirs of cultivable opportunistic bacteria originating from mixed waste streams (32). Likewise, the recovery of Aeromonas spp. from multiple sampling stations reflects their ecological versatility and capacity to persist in moist, organic-rich waste environments (14, 33, 34, 35, 36).
Among the recovered bacteria, Aeromonas spp. consistently expressed DNase and gelatinase activities, with most isolates also demonstrating hemolytic activity, whereas these phenotypes were less frequently observed in the remaining bacterial groups. These extracellular activities have been associated with nutrient acquisition, environmental persistence, and host colonization in opportunistic bacteria (37, 38, 39). However, the presence of virulence-associated phenotypes alone does not establish pathogenicity because bacterial virulence depends on the coordinated expression of numerous genetic and environmental factors that were not investigated in the present study. Instead, these observations indicate that some landfill-associated bacteria possess phenotypic characteristics commonly associated with opportunistic microorganisms and therefore warrant further investigation using molecular approaches capable of identifying virulence-associated genes and their regulation.
The present investigation employed culture-dependent methods and therefore characterized only the cultivable fraction of the landfill bacterial community. Although culture-independent approaches provide a broader assessment of microbial diversity, culture-based studies remain important because they permit direct phenotypic characterization of individual bacterial isolates, including antimicrobial susceptibility testing and evaluation of virulence-associated traits that cannot be inferred solely from community sequencing data. The combined use of conventional biochemical characterization and 16S rRNA gene sequencing of representative isolates therefore provided reliable taxonomic identification while enabling subsequent phenotypic analyses relevant to environmental surveillance.
Following exclusion of antimicrobial agents for which resistance is considered intrinsic according to current EUCAST recommendations (16), acquired or potentially acquired resistance remained widespread among the recovered bacterial isolates. Resistance to multiple antimicrobial classes and the occurrence of elevated MAR indices among numerous isolates support previous observations that landfill environments represent reservoirs of antimicrobial-resistant bacteria. The continuous deposition of municipal, agricultural, industrial, and healthcare wastes likely exposes resident bacterial communities to diverse anthropogenic selective pressures, including antibiotic residues, disinfectants, and other contaminants that favor the persistence of resistant bacterial populations. In addition to direct antibiotic exposure, landfill environments may promote the co-selection of antimicrobial resistance through the presence of heavy metals and other environmental contaminants that exert shared selective pressures on microbial communities, although these factors were not evaluated in the present study. Although the present study did not determine the genetic basis of resistance, the observed phenotypic patterns demonstrate that acquired antimicrobial resistance is well established among cultivable bacteria inhabiting this landfill ecosystem.
Several bacterial taxa, particularly Aeromonas spp. and selected Bacillus spp., exhibited both multidrug resistance and virulence-associated phenotypes. While the present study did not investigate the genetic relationship between these characteristics, their coexistence is environmentally relevant because bacteria possessing multiple adaptive traits may be better equipped to survive under stressful environmental conditions (40). These observations should not be interpreted as evidence of increased pathogenic potential but rather as an indication that landfill sediments harbor bacterial populations with characteristics that justify continued environmental surveillance and more detailed molecular investigation.
From a One Health perspective, landfill ecosystems represent environmental interfaces where microorganisms originating from human, animal, agricultural, and industrial sources coexist under diverse selective pressures. Such environments may facilitate the long-term persistence of antimicrobial-resistant bacteria and provide opportunities for their dissemination through landfill leachate, surface runoff, wildlife, domestic animals, or occupational exposure among waste workers (41, 42). In tropical regions such as the Philippines, heavy rainfall and seasonal flooding may further increase hydrological connectivity between landfill systems and adjacent aquatic environments. Although these potential dissemination pathways were not investigated in the present study, the findings reinforce the importance of including landfill ecosystems within broader environmental AMR surveillance programs alongside clinical and agricultural monitoring initiatives. Accordingly, landfill ecosystems should be recognized as important environmental compartments within national One Health surveillance strategies aimed at monitoring the emergence and dissemination of antimicrobial resistance.
Several limitations should be considered when interpreting the present findings. First, the investigation was restricted to cultivable bacteria and therefore does not represent the entire landfill microbiome. Second, antimicrobial resistance was assessed phenotypically, and the underlying resistance genes or molecular mechanisms were not characterized. Third, environmental factors that may contribute to antimicrobial co-selection, including heavy metals and antibiotic residues, were not determined. Consequently, the observed resistance profiles should be interpreted as evidence of phenotypic antimicrobial resistance rather than confirmation of specific genetic determinants. Furthermore, only representative isolates were subjected to 16S rRNA gene sequencing; therefore, less abundant bacterial taxa may have remained undetected. Future studies integrating metagenomics, whole-genome sequencing, resistome analyses, characterization of mobile genetic elements, and measurements of environmental contaminants would provide a more comprehensive understanding of the ecological processes governing bacterial persistence and antimicrobial resistance dissemination in Philippine landfill ecosystems.
In conclusion, this study provides the first baseline characterization of the cultivable bacterial community inhabiting sediments of the Calajunan Sanitary Landfill, Iloilo City, and represents one of the few integrated investigations of landfill-associated bacteria conducted in the Philippines. The predominance of Bacillus spp., together with the recovery of diverse opportunistic Gram-negative bacteria exhibiting virulence-associated phenotypes and acquired antimicrobial resistance, demonstrates that landfill sediments constitute important environmental reservoirs of cultivable bacteria with ecological and public health relevance. Organic carbon, total nitrogen, pH, and calcium were the physicochemical variables most closely associated with bacterial distribution, highlighting the contribution of sediment characteristics to shaping the cultivable bacterial community.
Although limited to culture-dependent analyses, this study establishes an important baseline for future environmental monitoring and One Health-based antimicrobial resistance surveillance in Philippine landfill ecosystems. Future studies integrating culture-independent approaches, whole-genome sequencing, resistome analyses, and environmental contaminant measurements will further clarify the ecological processes and genetic mechanisms underlying bacterial persistence and antimicrobial resistance dissemination in landfill environments.