

INTRODUCTION
Analysis of the mycobiome has provided deep understanding into their role in human health and disease (1). In healthy subjects, the biomass of the oral mycobiome is relatively low compared to the bacterial load (2). Intubation and critical illness can reduce oral immunity and exacerbate poor oral hygiene (3, 4). In intubated patients, fungal load including Candida rapidly increases after admission to an intensive care unit (ICU) (5). Fungal infections cause a significant proportion of health care associated infections (HAIs) and Candida species have been reported as the most prevalent pathogens causing HAIs (6, 7). Characterizing oral mycobiome is the first step to understand the shift of oral mycobiome and design proper management.
Over the past few years, internal transcribed spacer (ITS) regions has been considered for mycobiome community survey, and many studies have been used various primer sets to characterize mycobiome structure (8, 9, 10, 11, 12, 13). The ITS region is located between the 18S and 26S rRNA genes and is subdivided into the ITS1 region and the ITS2 region. ITS2 is located between the 5.8S and 26S rRNA genes and it has been suggested to be useful for the identification of clinically important fungi (14). ITS3/ITS4 primer and ITS7/ITS4 primer are among the primers targeting ITS2 region to evaluate the mycobiome community (8, 15, 16, 17).
However, no study has tested the performance of these primer sets on oral mycobiome communities. Therefore, we tested two primers (ITS3/ITS4 and ITS7/ITS4) targeting ITS2 to evaluate their performance on oral mycobiome analysis.
MATERIAL AND METHODS
Participants
The inclusion criteria for ICU patients were; 1) > 18 years of age, 2) endotracheal tube use with holding methods, 3) consent for participation from the patient’s family. This study was approved by the Institutional Review Board (DAUHIRB-19-072). ICU participants in this study were mostly sedated or at severely poor levels of consciousness; therefore, family members were considered as the legal representatives with the power of attorney based on the International Council for Harmonization (18). During the participant recruitment period, the purpose, voluntary nature of participation, confidentiality of information, and procedures used in the study were explained to family members, and informed consent was obtained from each family.
Oral swab sample preparation
Buccal swap samples were collected using the Levine technique; the swab was rotated over an approximately 1cm2 area with sufficient pressure (19). Sterile cotton swabs were used for the collection and were placed in a 15 mL conical tube labelled with the sample ID and stored at -80°C.
Extraction of Genomic DNA and Next Generation Sequencing
Before analysis, samples were suspended in phosphate buffered saline (PBS), vortexed, and then centrifuged. DNA was extracted using a Gram positive DNA purification kit (Lucigen, Biosearch Technology, Novato, CA) following the manufacturer’s instructions. The final concentration was measured with a NanoDrop ND-1000 spectrophotometer (Thermo Fisher Scientific Inc, Waltham, MA) and stored at −80°C until use. PCR amplification of the ITS2 was performed. The primer sequences used for amplifications were as follows: ITS3-F: 5’- GCA TCG ATG AAG AAC GCA GC-3’, ITS7-F: 5’- GTG ART CAT CGA RTC TTT G-3’, ITS4-R: TCC TCC GCT TAT TGA TAT GC-3’ (15, 16). Theoretical target size for ITS3/ITS4 and ITS7/ITS4 primer pair were 300-400 bps and 230-330 bps, respectively. Purified amplicons were pooled in equimolar and paired-end sequenced with MiSeq (Illumina, San Diago, CA, USA).
Bioinformatic Analysis, Statistical Analysis, and Visualization
Basic microbiome analyses have been performed using the QIIME2 (version 2020.6) (20) and associated plugins. To measure alpha diversities, Faith PD index, Choa1 index, and Shannon’s index method were used. For the beta diversity analysis, the weighted UniFrac was used. The Mann–Whitney U test was used to assess the statistical significances between the groups for alpha diversities. To assign taxonomy to the unique representative sequences, pre-trained Naive Bayes classifier, using UNITE Database (21), was used. Phyloseq package was used to construct phylogenetic tree (22).
RESULTS
Participant characterization and sequence processing result
The 5 enrolled ICU patients (all male, age 68.4 ± 8.5) included a heterogeneous set of underlying diseases and acute indications for mechanical ventilation (Table 1). Four subjects were sampled at multiple time points. A total of 20 samples were tested with both ITS3 and ITS7 primers.
Table 1.
Characterization of patients
| Subject | Age | Sex | Underlying disease |
|---|---|---|---|
| 1 | 81 | M | COPD, DM, Alcoholic hepatitis |
| 2 | 65 | M | COPD, DM |
| 3 | 67 | M | Alcoholic hepatitis |
| 4 | 71 | M | Lung Cancer |
| 5 | 58 | M | DM, Liver cirrhosis |
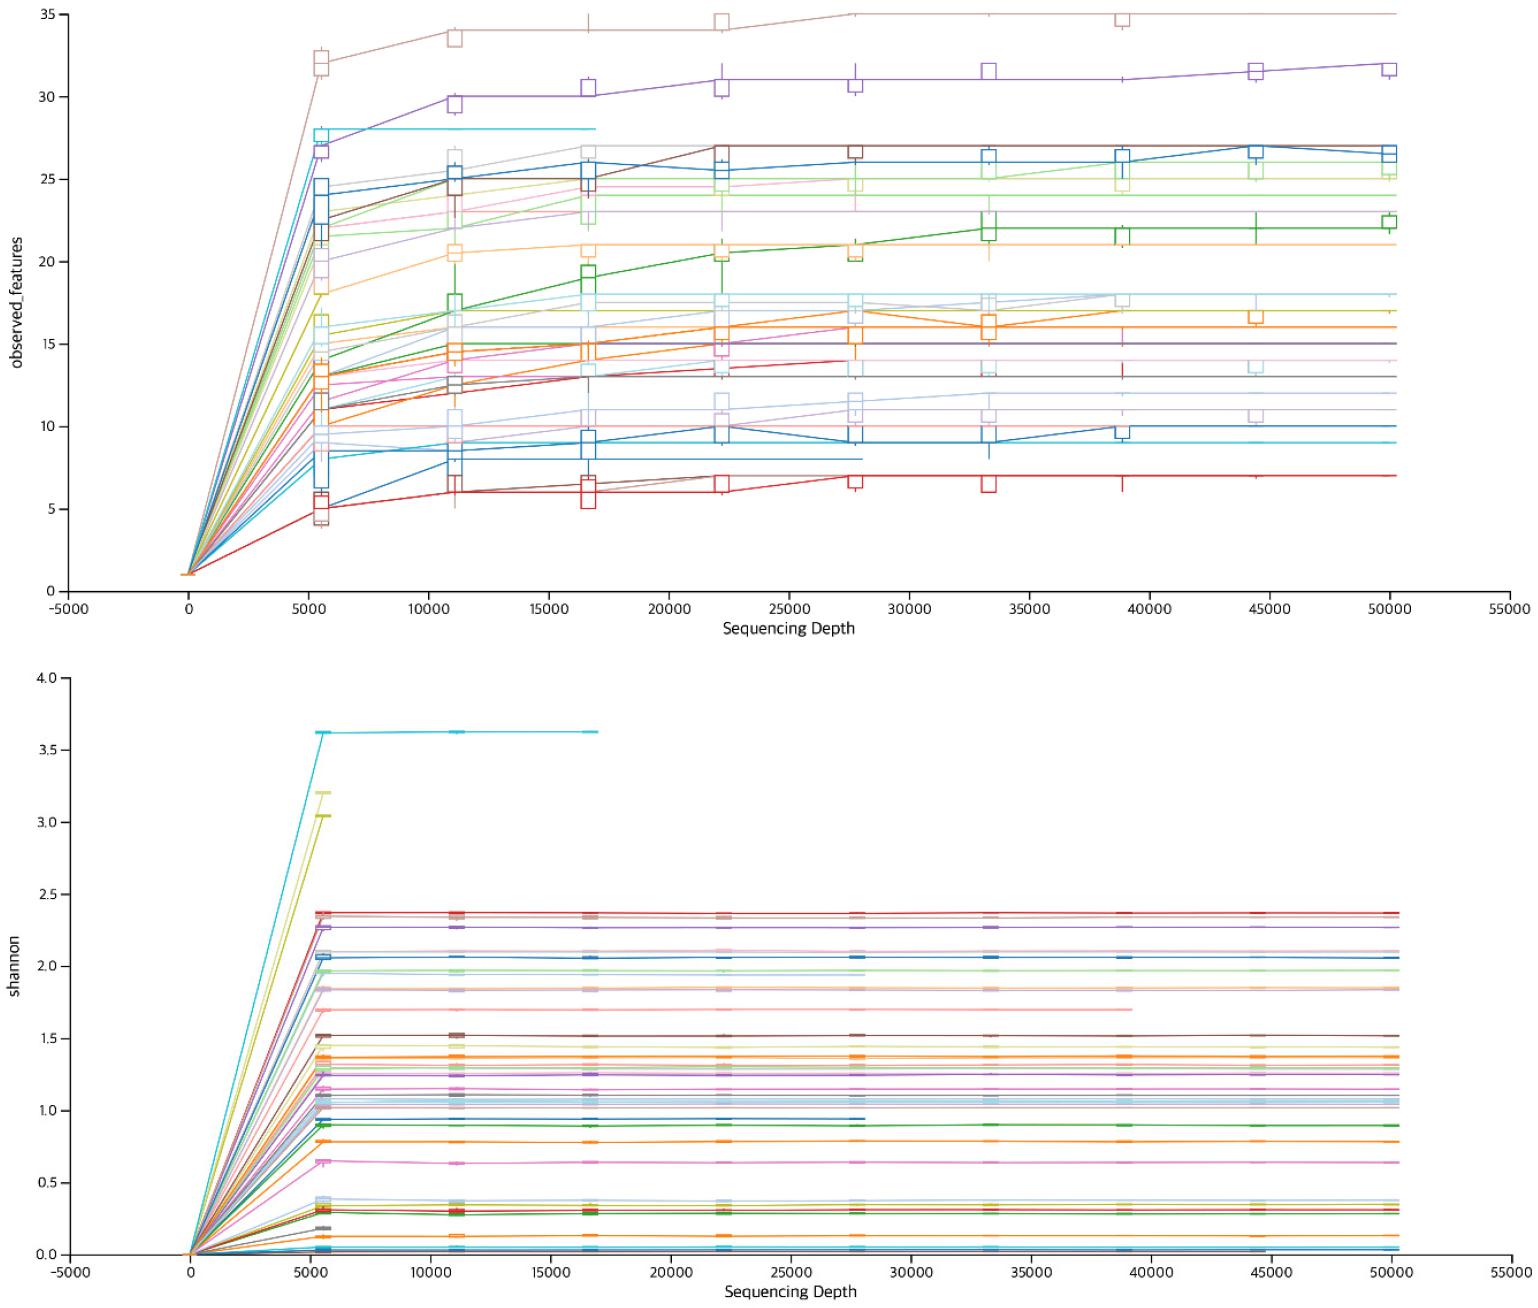
A total of 1,347,141 reads (67,357 ± 32,979) were collected using ITS3 primers and 2,111,074 reads (91,786 ± 34,952) were collected using ITS7 primers. DADA2 was applied and final read count were 62,535 ± 29,007 and 82,956 ± 34,574 for ITS3 and ITS7, respectively. Total read counts obtained from ITS7 primers was significantly higher than ITS3 primers (Table 2). The minimum read count was 9,011 and 8,697 for ITS3 and ITS7, respectively. When rarefaction curve of observed OTU was plotted, all the samples reached plateau, suggesting sufficient number of read counts were obtained for further analysis (Fig. 1). The paired read length was 359.4 ± 47.3 and 311.5 ± 43.4 for ITS3 and ITS7, respectively. ITS3 primers produced significantly longer read length compared to ITS7 primers.
Table 2.
The number of sequence reads during data processing and paired read length
Diversity of the mycobiome
ITS2 region was targeted to compare the reliability of fungal diversity surveying the oral mycobiome composition. The alpha diversity was estimated by Chao1, Faith PD and Shannon test. When the phylogeny of the taxa was not considered, ITS7 showed higher richness (Chao1, p=0.022586) (Fig. 2A) and evenness (Shannon index, p=0.000018) (Fig. 2C). However, there was no significant difference in Faith PD, which uses phylogenetic distance to calculate the richness of the diversity (Fig. 2B). To compare the mycobiome structure, beta diversity was determined using weighted UniFrac, which considers the phylogeny of the taxa. The respective oral samples showed nearby distribution suggesting the mycobiome was similar between ITS3 primer and ITS7 primers (Fig. 2D).
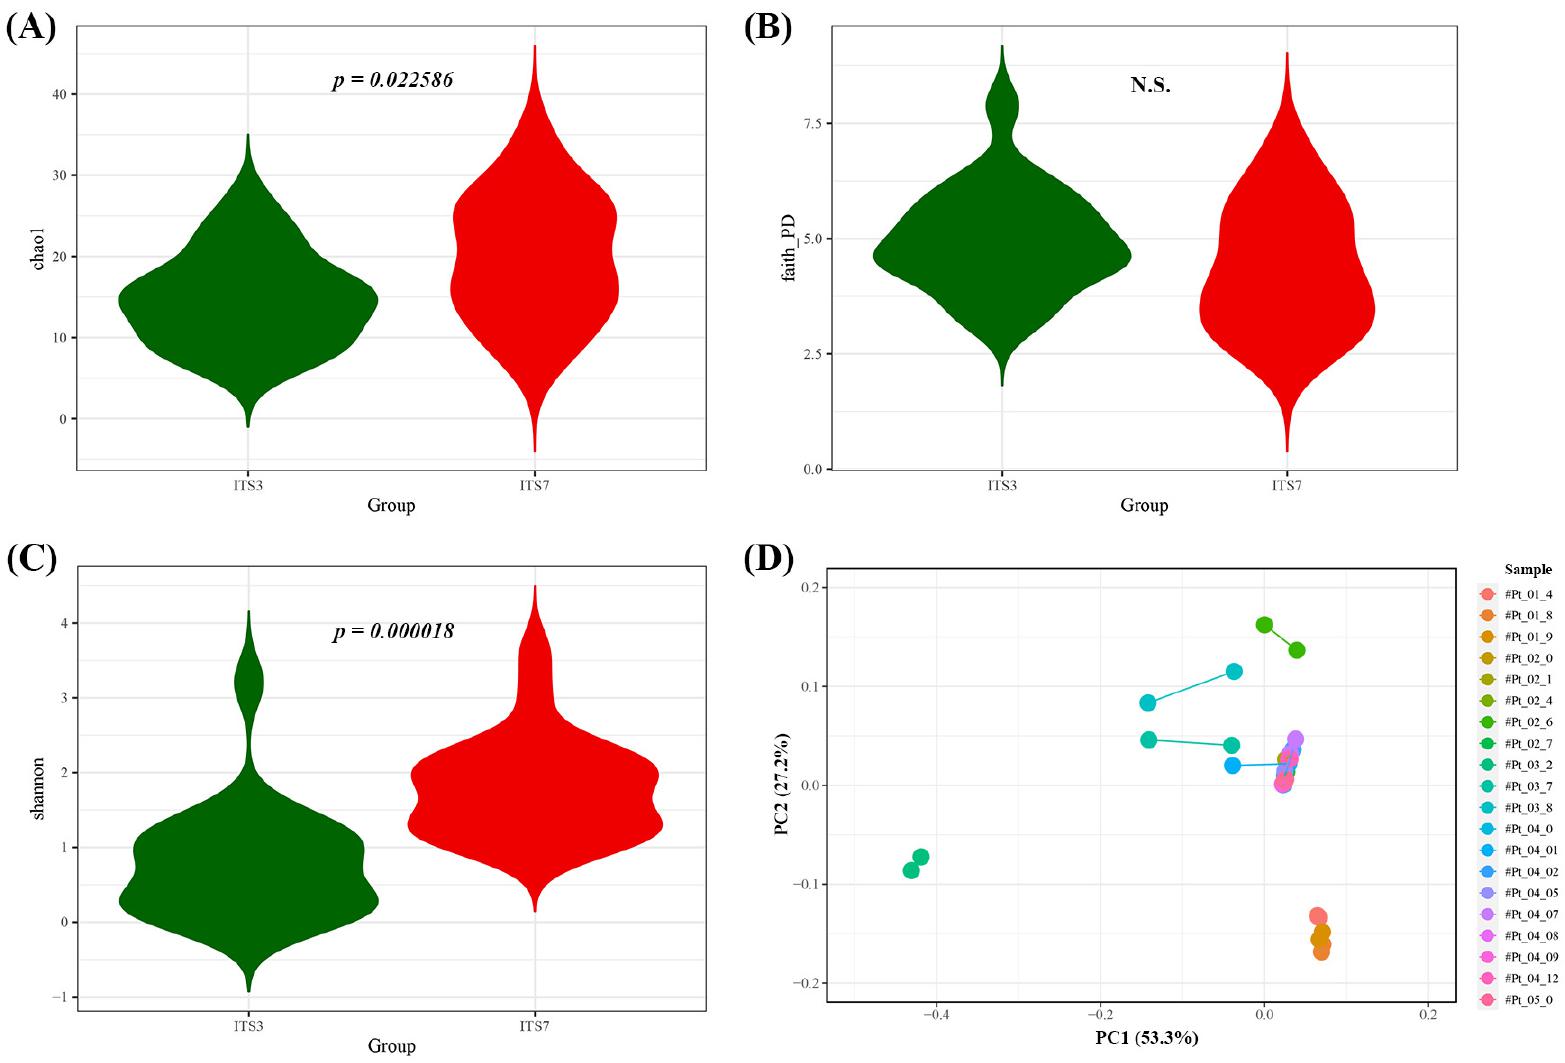
Fig. 2
Mycobiome community comparisons. Alpha diversity comparison between ITS3 primer and ITS7 primer. Chao1 alpha diversity (A), Faith’s PD alpha diversity (B), and Shannon alpha diversity (C). (D) Beta diversity of each sample connected with line. Principal coordinate analysis (PCoA) of the Weighted UniFrac was performed to determine the mycobiome structure.
Species comparison
Next, phylogenetic tree was constructed to compare the species assigned by ITS3 primer and ITS7 primer. Candia formed the major tree which included C. albicans, C. tropicalis, and C. parapsilosis. Second tree included Wickerhamomyces anomalus, Meyerozyma carbbica, Debaryomyces hansenii, C. glabrata and C. sake. Another tree included Clavispora lusitaniae (C. lusitaniae), C. intermedia and Yarrowia porcina (Y. porcina). There were three more trees that were unidentified at the species level. Interestingly, there were several species that was only assigned by ITS3 primer which include C. sake, C. intermedia, C. parapsiolisis and Y. porcina (Fig. 3).
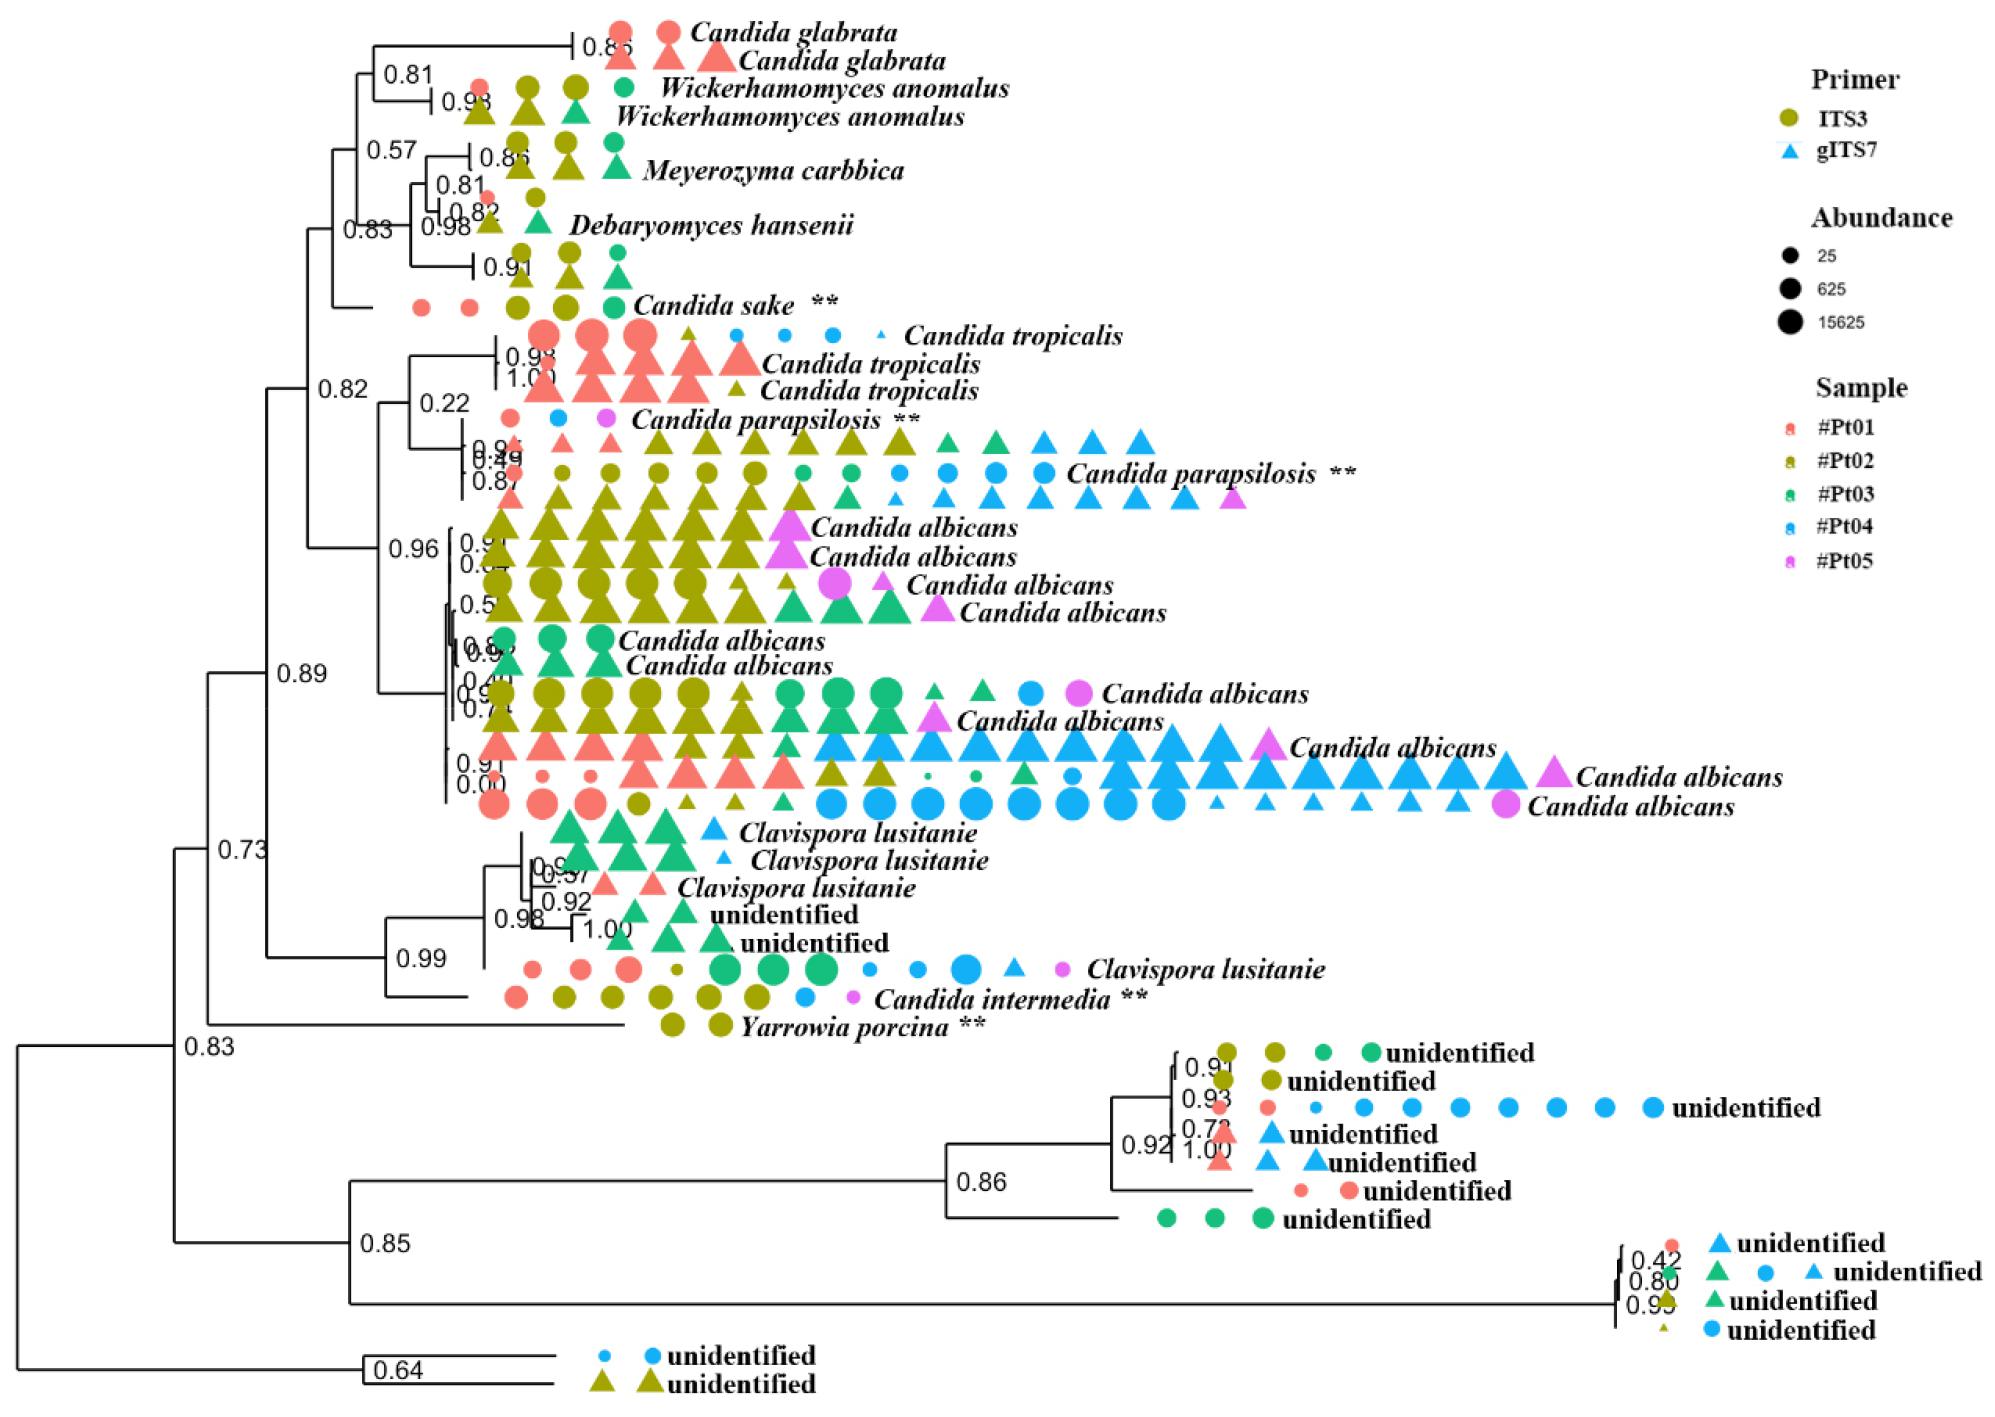
Fig. 3
Phylogenetic relationships among mycobiome sequenced with ITS3 and ITS7 primers. Primers are shown in shape and patient samples are shown in color. The size of the shapes indicates the relative abundance of the taxon in the sample.
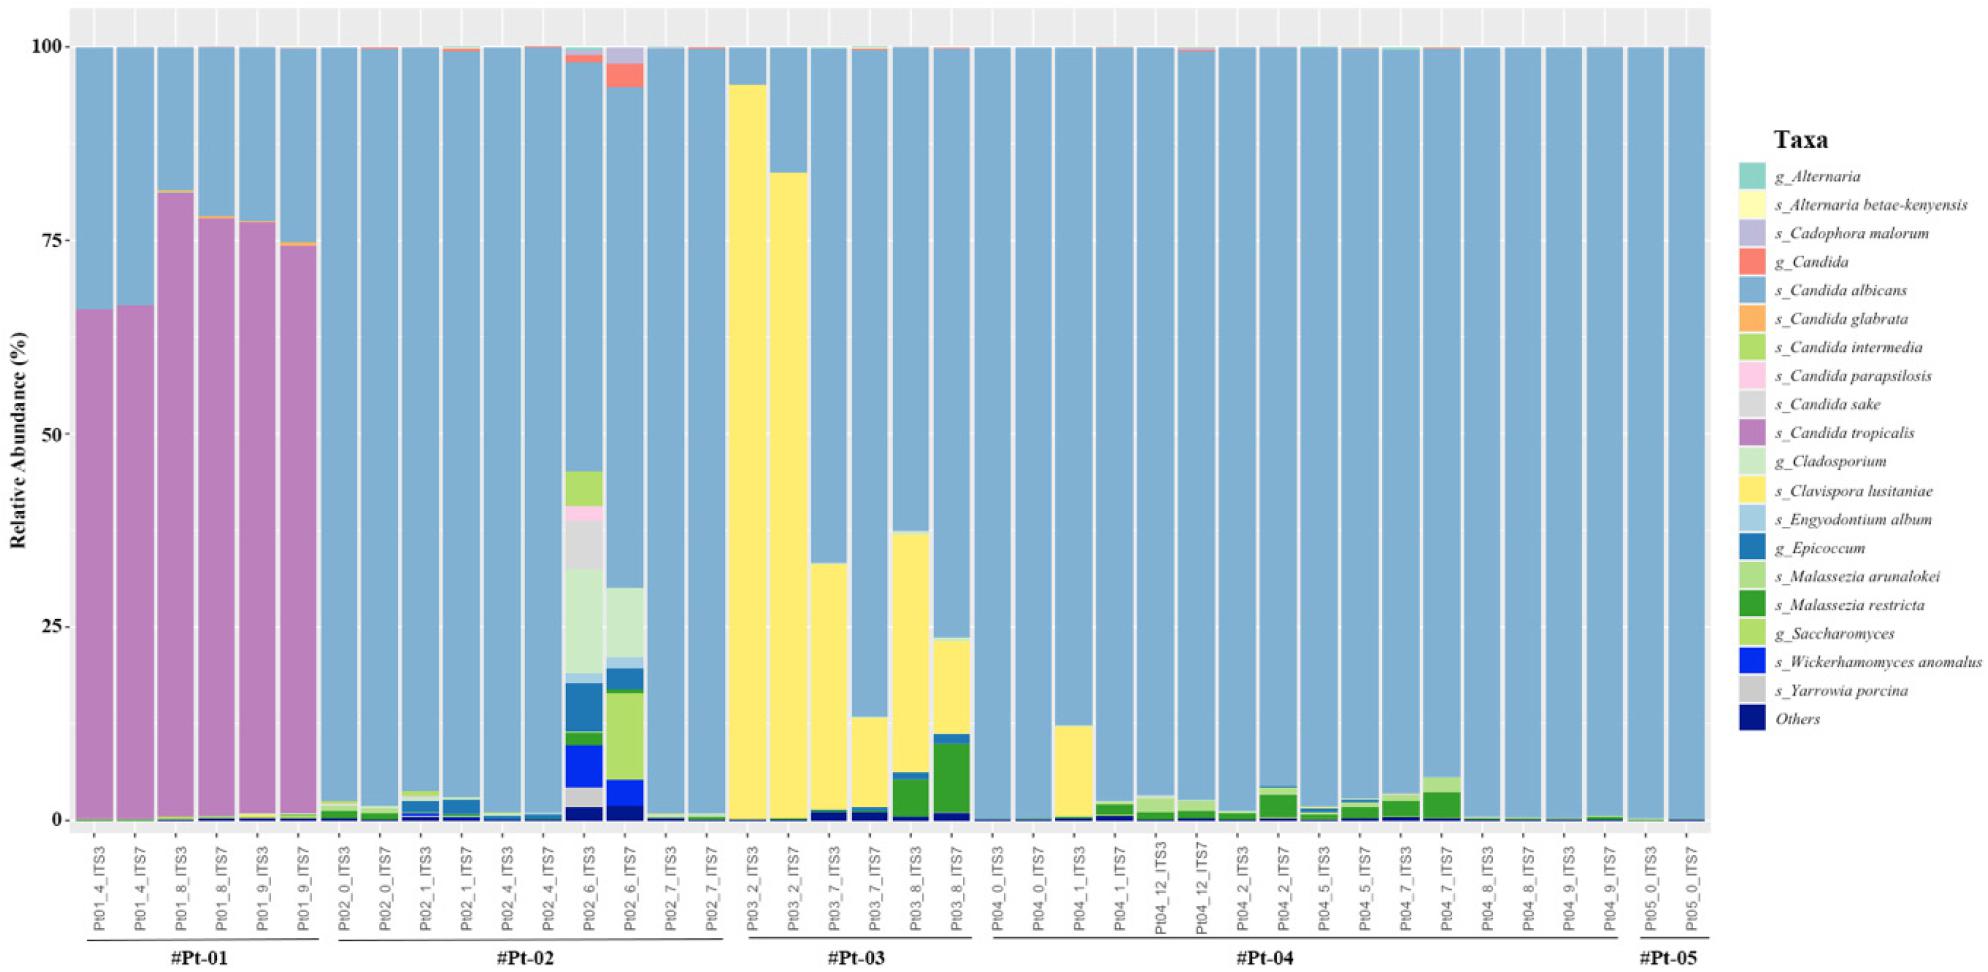
Finally, relative abundance of each sample was plotted to observe the fungal abundance (Fig. 4). The most abundant species was C. albicans and the relative abundance showed similar proportion in most samples. However, the abundance of C. lusitaniae was assigned more abundant (9.98% vs 6.29%) using ITS3 primer in several samples (p=0.047). Also, C. sake (5/20), C. intermedia (8/20), C. parapsiolisis (15/20) and Y. porcina (2/20) was only assigned by ITS3 primer. Although both primers assigned Alternaria at the genus level, A. betae-kenyesis was only assigned by ITS7 primer (10/20). Although not significant, the abundance of Malassezia species including M. arunalokei and M. restricta was assigned more abundant using ITS7 primer (p=0.057).
DISCUSSION
While the biomass of the oral mycobiome is low in healthy subjects (2), mycobiome including Candida rapidly increases in intubated patients with reduced oral immunity and poor oral hygiene (5). To determine the mycobiome community, ITS region, which is located between the 18S and 26S rRNA genes, is one of the most frequently targeted for clinically important fungi (14). In this study, we tested two primer sets (ITS3/ITS4 and ITS7/ITS4) targeting ITS2 to evaluate their performance on oral mycobiome analysis.
Since same reverse primer was used, the read length was dependent on the forward primer and ITS3 primers (359.4 ± 47.3) produced significantly longer read length compared to ITS7 primers (311.5 ± 43.4). To determine the richness and evenness of the mycobiome, alpha diversity was analyzed. The richness and evenness of ITS7 primer were significantly higher at the OTU (operational taxonomy unit) level compared to ITS3 primers (Figs. 2B and 2C). However, there was no significant difference in Faith PD, which considers phylogenetic distance. To compare the mycobiome structure, beta diversity was determined using weighted UniFrac, which takes into account the phylogeny of the taxa. The respective oral samples showed nearby distribution suggesting the mycobiome structure was similar between ITS3 primer and ITS7 primer (Fig. 2D). Taken together, although ITS7 produced more OTUs, the overall performance in determining mycobiome structure was similar between ITS3 primer and ITS7 primer.
Finally, relative abundance was compared at the species level. In both primer set, the most abundant species was C. albicans and the relative abundance showed similar proportion in most samples. An increase in oral C. albicans has been shown to increase the risk of candidemia (23). Although C. albicans is the predominant cause of candidiasis, a shift toward non-albicans Candida species has been reported (24). Non-albicans Candida species have reduced susceptibility to antifungal drugs. Resistance to the azole group was more common in non-albicans Candida species compared to C. albicans(25). Thus, discriminating C. albicans from non-albicans Candida species is import for efficient management. Interestingly, there were several species that was only assigned by ITS3 primer including C. sake, C. intermedia, C. parapsiolisis and Y. porcina. Moreover, the abundance of C. lusitaniae was higher (9.98% vs 6.29%) using ITS3 primer. C. lusitaniae can be isolated from environmental samples and it is can rapidly develop resistance to multiple antifungal drugs during treatment (26, 27). Taken together, ITS3 primer showed better performance in characterizing Candida species in oral cavity at the species level.
In this study, we compared the performance between two primers in predicting oral mycobiome in intubated patients. Other primers should also be performed for optimum prediction. Selecting optimum primers should provide better understanding of the mycobiome community in oral cavity.
